
 Yahoo Finance
 Forex Analysis: Dollar Launches Recovery as S&P 500 Selloff Continues
THE TAKEAWAY: The US Dollar has launched a recovery, with technical positioning hinting a larger advance is ahead, while the S&P 500 is building on recent losses.
US DOLLAR TECHNICAL ANALYSIS– Prices are resting at rising trend line support set from the mid-September bottom, with the outlines of a Flag chart formation hinting at bullish continuation. A Piercing Line candlestick pattern reinforces the case for an upside scenario. A break above Flag resistance at 9970 initially exposes the 23.6% Fibonacci expansion at 9995. Alternatively, a drop below the trend line (now at 9942) targets the Flag bottom at 9890.
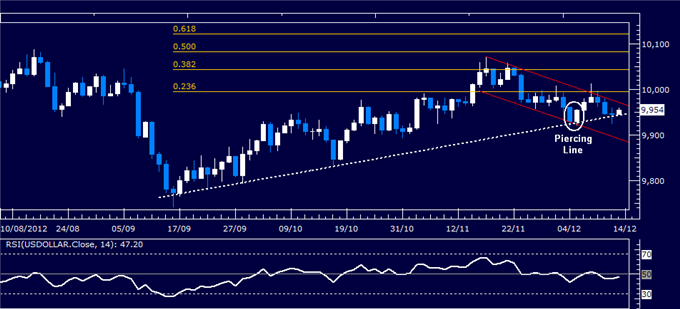
Daily Chart - Created Using FXCM Marketscope 2.0
S&P 500 TECHNICAL ANALYSIS – Prices put in a bearish Three Inside Down candlestick pattern in the 1425.40-38.90 resistance area, a barrier reinforced by a falling trend line set from the mid-September swing high (now at 1440.10). The setup hints a move lower is ahead. The appearance of a bearish continuation Flag chart formation reinforces the case for a downside scenario. A break below the Flag bottom at 1414.70 confirms the setup, exposing a measured downside target at 1381.00. Alternatively, a move above 1440.80 targets the next upside hurdle at 1466.10.
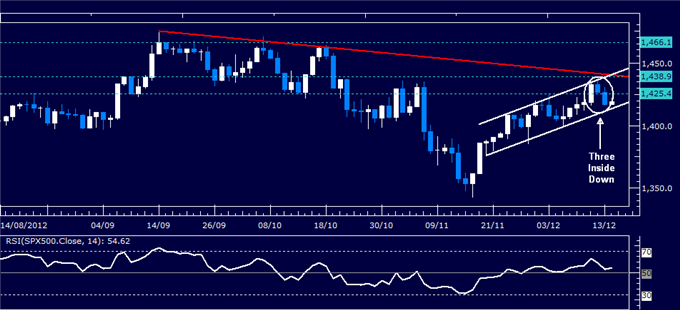
Daily Chart - Created Using FXCM Marketscope 2.0
GOLD TECHNICAL ANALYSIS – Prices broke lower after putting in a Bearish Engulfing candlestick pattern, taking out support at a rising trend line set from late June. A move lower is now materializing as expected following a Hanging Man candle completed on a retest of this barrier. Near-term support is at 1692.41, the 50% Fibonacci expansion. A break below that exposes the 61.8% level at 1677.84. Trend line support-turned-resistance is at 1719.00, with a break above that broadly targeting 1752.55 anew.
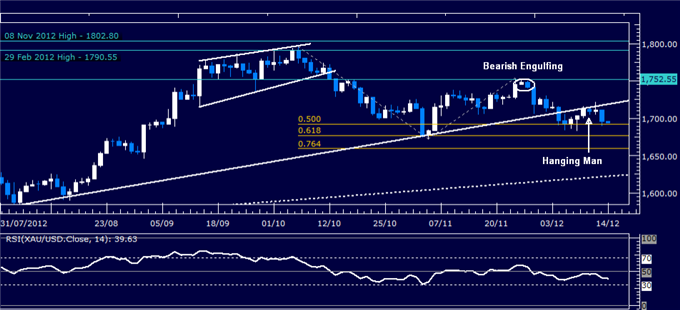
Daily Chart - Created Using FXCM Marketscope 2.0
Want to learn more about RSI? Watch this Video.
CRUDE OIL TECHNICAL ANALYSIS– Prices moved lower as expected after putting in a Shooting Star candlestick. A bearish continuation Flag chart pattern now appears to be validated with a break through the setup’s lower boundary. Near-term support is at 85.61, the 50% Fibonacci expansion. A break below that exposes the 61.8% Fib at 84.50. Alternatively, a push back above the Flag bottom (87.03) aims for 89.19
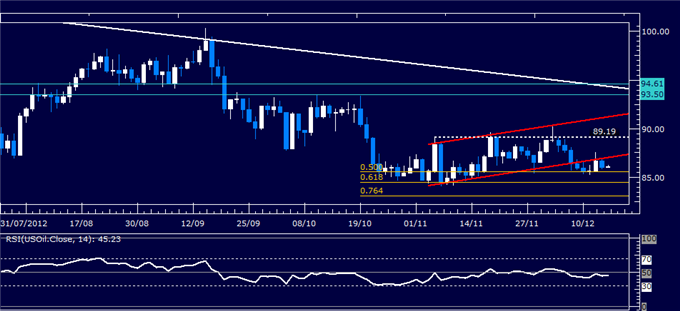
Daily Chart - Created Using FXCM Marketscope 2.0
--- Written by Ilya Spivak, Currency Strategist for Dailyfx.com
To contact Ilya, e-mail ispivak@dailyfx.com. Follow Ilya on Twitter at @IlyaSpivak
To be added to Ilya's e-mail distribution list, please CLICK HERE
DailyFX provides forex news and technical analysis on the trends that influence the global currency markets.
Learn forex trading with a free practice account and trading charts from FXCM.
