
 Yahoo Finance
 Forex Analysis: Can the Dollar Capitalize as S&P 500 Spikes Lower?
THE TAKEAWAY: The S&P 500 spiked sharply lower as US fiscal cliff jitters hit fever pitch, with downside follow-through from here offering a potent driver for Dollar gains.
US DOLLAR TECHNICAL ANALYSIS– Prices staged a mild recovery from neckline support established from late October (now at 9928) to retest trend line support-turned-resistance at 9958. A break above that aims for the 23.6% Fibonacci expansion at 9995. Alternatively, a drop below neckline support eyes the channel bottom at 9867.
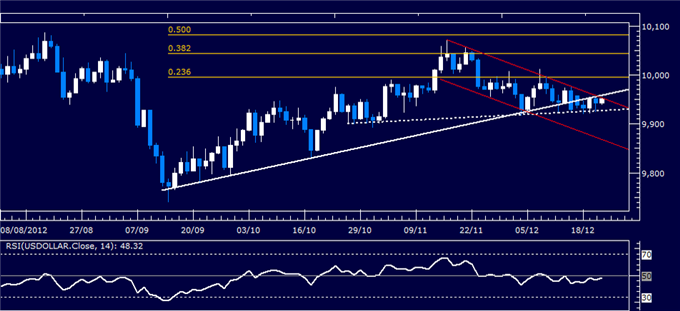
Daily Chart - Created Using FXCM Marketscope 2.0
S&P 500 TECHNICAL ANALYSIS – Prices put in a bearish Dark Cloud Cover candlestick below falling trend line resistance set from the September 14 high (1444.80), hinting a move lower is ahead. Negative RSI divergence reinforces the case for a downside scenario. Sellers are now testing through initial rising channel support at 1421.9l0, with a confirmed break downward on a daily closing basis exposing 1398.10. Alternatively, a reversal above the trend line aims for the channel top at 1452.00.
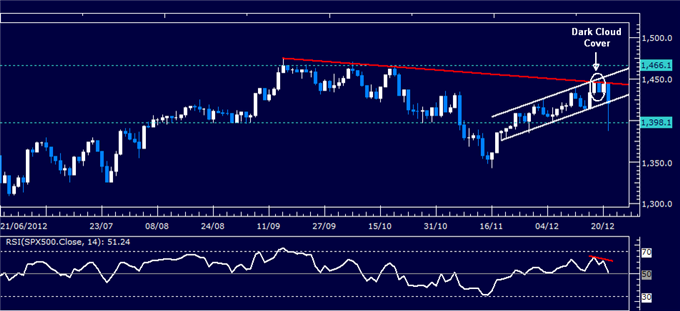
Daily Chart - Created Using FXCM Marketscope 2.0
GOLD TECHNICAL ANALYSIS – Prices plunged through support at 1659.90, the 76.4%Fibonacci expansion. Sellers now aim to challenge the 100% mark at 1630.97, a barrier reinforced by the bottom of a falling channel carved out since mid-September. A further drop below this boundary aims for the 123.6% Fib at 1601.78. The 1659.90 level has been recast as resistance, with a reversal back above that targeting the 61.8% expansion at 1677.84.
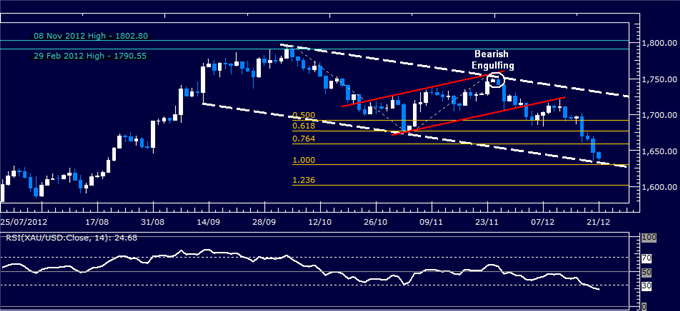
Daily Chart - Created Using FXCM Marketscope 2.0
Want to learn more about RSI? Watch this Video.
CRUDE OIL TECHNICAL ANALYSIS– Prices are testing the top of what may prove to be a bearish Flag chart pattern (90.37). A reversal lower from here that produces a close below pattern support (now squarely at 86.00) confirms the setup, implying a measured downside target at 81.63. Alternatively, a break above 90.37 targets falling trend line resistance at 94.04.

Daily Chart - Created Using FXCM Marketscope 2.0
--- Written by Ilya Spivak, Currency Strategist for Dailyfx.com
To contact Ilya, e-mail ispivak@dailyfx.com. Follow Ilya on Twitter at @IlyaSpivak
To be added to Ilya's e-mail distribution list, please CLICK HERE
DailyFX provides forex news and technical analysis on the trends that influence the global currency markets.
Learn forex trading with a free practice account and trading charts from FXCM.
