
 Yahoo Finance
 Flying Through the Business Cycle, Fed Needs to Land the Plane (Capital Market Research) (Weekly Market Outlook)
MOODY’S ANALYTICS CAPITAL MARKETS RESEARCH / WEEKLY MARKET OUTLOOK
1
Moody’s Analytics and Moody’s Investors Service maintain separate and independent economic forecasts. This publication uses the
forecasts of Moody’s Analytics. Moody’s Analytics markets and distributes all Moody’s Capital Markets Research materials.
Moody’s Analytics does not provide investment advisory services or products. For further detail, please see the last page.
Flying Through the Business
Cycle, Fed Needs to Land the
Plane
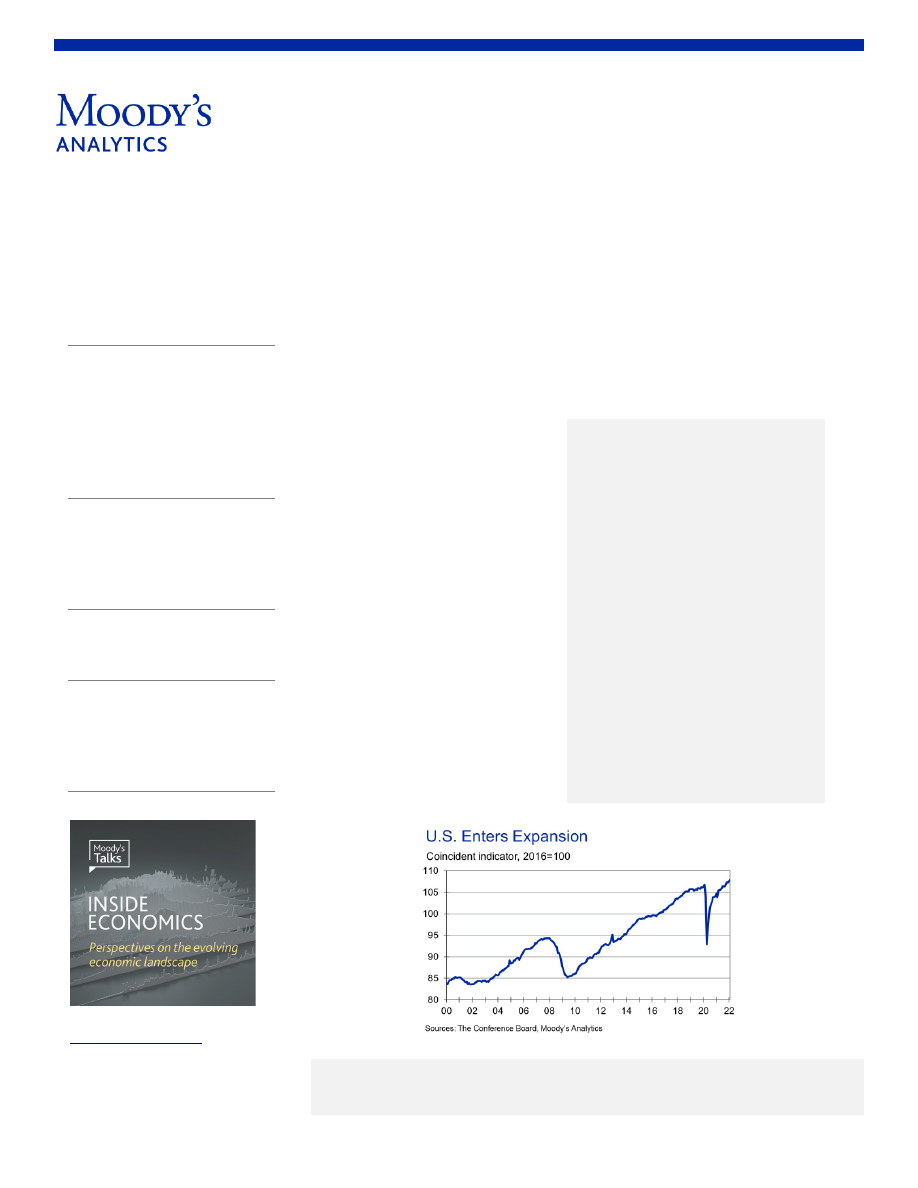
The U.S. economy is flying through the
different phases of the business cycle;
we recently moved the economy from
the recovery to expansion phase of the
business cycle. This was partly based on
the Conference Board’s consumer
coincident indicator, which recently
surpassed its prior peak.
Not everyone differentiates between
recoveries and expansions, and the two
terms are sometimes used
interchangeably. The National Bureau of
Economic Research's Business Cycle
Dating Committee—the de facto arbiter
of the economy's peaks and troughs—
defines any period from a trough to a
peak as an expansion, labeling the
remainder of the cycle a recession.
WEEKLY MARKET
OUTLOOK
MARCH 24, 2022
Lead Authors
Ryan Sweet
Senior Director-Economic Research
Mark Zandi
Chief Economist
Chris Lafakis
Director
Asia-Pacific
Denise Cheok
Economist
Heron Lim
Economist
Europe
Ross Cioffi
Economist
U.S.
Steven Shields
Economist
Matt Orefice
Data Specialist
Podcast
Table of Contents
Top of Mind ....................................... 3
Week Ahead in Global Economy .. 6
Geopolitical Risks ............................ 7
The Long View
U.S. ....................................................................... 8
Europe ............................................................... 12
Asia-Pacific ..................................................... 13
Ratings Roundup ............................ 14
Market Data .................................... 18
CDS Movers .................................... 19
Issuance ........................................... 22

MOODY’S ANALYTICS CAPITAL MARKETS RESEARCH / WEEKLY MARKET OUTLOOK
2
Many economists, however, use "recovery" to mean the
period just after a recession, until real GDP surpasses its
prerecession level. However, this is a rather narrow
definition; GDP often recovers ahead of other indicators.
The Conference Board's indicator incorporates a broader
range of factors to determine when a recovery becomes an
expansion.
There are three phases of an expansion: early-, mid- and
late-stage, with the mid-stage usually being the longest. To
identify where we are in the expansion, we used a K-means
clustering approach to spot patterns and map the economic
data. It points toward an early-stage expansion. Considering
the nature of the recession and the subsequent recovery,
odds are that the economy will likely continue to shift
through the different states of the business cycle more
quickly than in the past.
Is the Fed panicking?
Our baseline forecast is for what the Federal Reserve will do,
rather than what it should do. Therefore, odds are there will
be some material changes to our assumptions about
monetary policy when we update the April baseline forecast.
Fed Chair Jerome Powell’s comments on Monday suggest
the Fed may not have any patience left and is set to
accelerate the removal of monetary policy accommodation.
Powell said, “There is an obvious need to move expeditiously
to return the stance of monetary policy to a more neutral
level.” This caused financial markets to adjust their
expectations for the path of the target fed funds rate.
Markets now expect the fed funds rate to be 2.25% at the
end of this year, a significant deviation from their
expectations this time last year.
Various measures of the yield curve continue to flatten,
which will catch the Fed’s attention. Lost in the debate
about the yield curve is that the correlation between
inversions and recessions doesn’t imply causation. The
inversion simply reflects the conditions that cause
recessions—for example, an overheating economy and
tighter monetary policy. Therefore, the Fed cannot lower the
risk of recession by simply pausing its current tightening
cycle to avoid an inversion in the yield curve. This could
increase the odds of recession, since delaying rate hikes
would cause the economy to overheat more quickly. Either
way, the Fed is in an enormous bind.
Could corporate bond market provide a pause?
Conditions in the U.S. corporate bond market also could
appear soon on the Fed’s radar. Recently, investment-grade
and high-yield U.S. corporate bond spreads widened
noticeably, albeit from very low levels. However, the speed
of the widening in U.S. corporate bond spreads has caught
our attention, even though it is unlikely to have an
immediate effect on monetary policy. There have been
instances in past tightening cycles where wider spreads in
the U.S. corporate bond market caused the Fed to pause.
The same likely holds today, but the Fed’s tolerance now is
for spreads significantly higher than they are right now.
Even with spreads widening, U.S. dollar-denominated
corporate bond issuance has held up well. This should
temper immediate concerns that wider spreads are going to
undermine businesses' access to credit. Corporate balance
sheets remain strong and the forecast for defaults remains
favorable, so the widening in corporate bond spreads may
not ding issuance as much as some fear. For now, the Fed
will forge ahead with its aggressive tightening cycle.
Soft landing or hard?
An aggressive Fed is priced in by the bond market as are the
odds of a policy error. The current U.S. Treasury futures
curve shows that the spread between the 10-year and two-
year Treasury yields will invert in the next three to six
months. The Treasury futures curve shows an inversion
between the 10-year and three-month Treasury yields in the
next 12 months. Markets believe a soft landing by the Fed is
unlikely.
We will keep a close eye on the yield curve. For the five
recessions we focused on, the average number of months
between an inversion in the spread for 10-year and two-year
Treasury yields and a recession was 24.5 months. However,
a more troubling development than an inversion in the yield
curve would be a steady rise in the unemployment rate or
declines in employment over several months. Both have
proven to be more accurate predictors of recessions, and
with shorter lead times than the yield curve.
If the unemployment rate begins to steadily increase in the
next 12 to 18 months, that would significantly increase the
risk of the U.S. experiencing a bout of stagflation.
MOODY’S ANALYTICS CAPITAL MARKETS RESEARCH / WEEKLY MARKET OUTLOOK
3
TOP OF MIND
Tough to Handicap the U.S. Outlook
BY MARK ZANDI and CHRIS LAFAKIS
The Russian invasion of Ukraine is a significant blow to the
global economy. Its impact is magnified as the economy
continues grappling with the ongoing
pandemic.
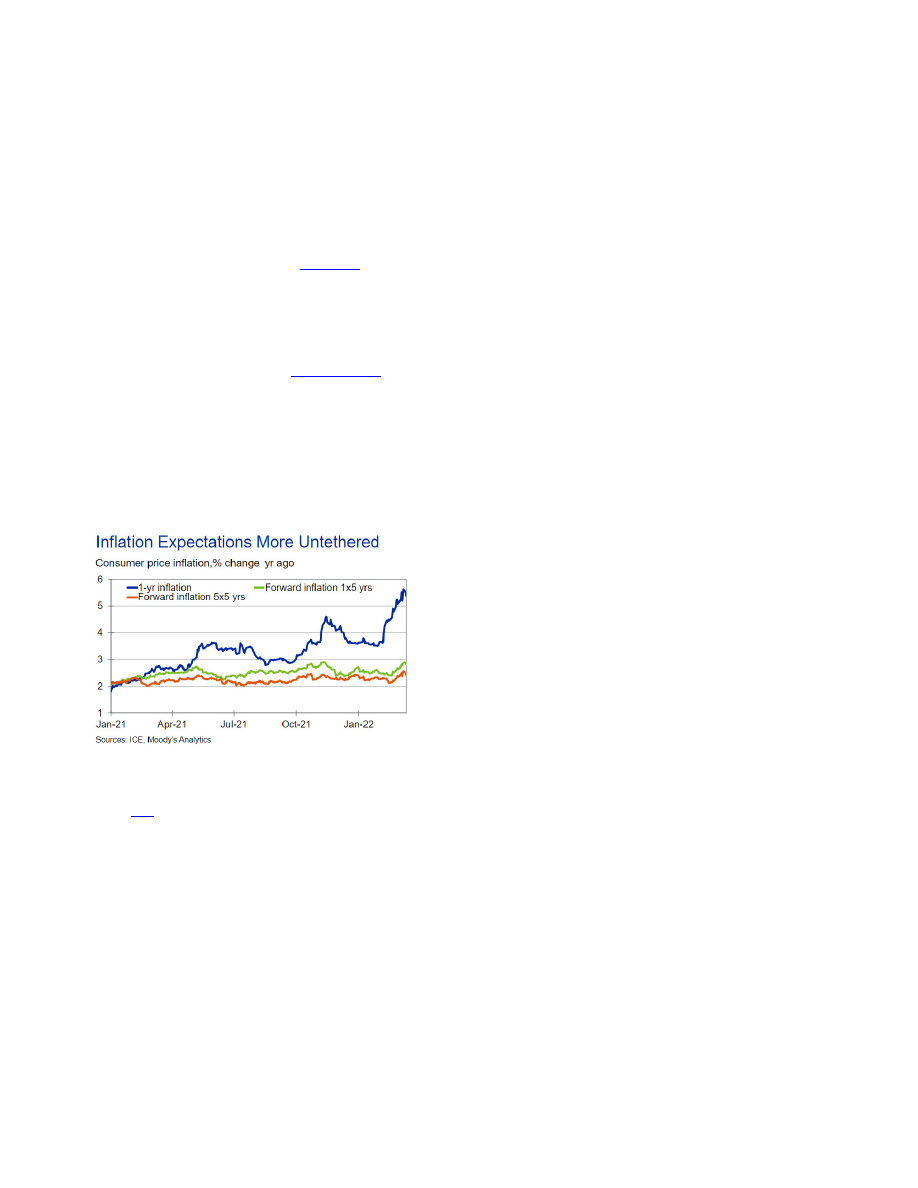
Sudden higher oil, natural gas, agricultural and metal prices
are conflating with already painfully high inflation caused by
the pandemic disruptions to supply chains and labor
markets. Inflation expectations were on the high side of
what is comfortable before the Russian invasion and now
appear increasingly untethered. The
began
normalizing interest rates last week but has much more
work to do, more quickly, to ensure that high inflation does
not become endemic. How the near-term economic outlook
unfolds critically depends on the path of the pandemic, how
the Russian invasion of Ukraine plays out, and whether the
Fed is successful in calibrating monetary policy to these
shocks and any other that may occur.
The most likely near-term outlook—our baseline—remains
that the
economic recovery will evolve into a self-
sustaining expansion in coming months (a 50% probability).
But recession is a serious threat (35% probability), and
dreaded stagflation—high inflation and high
unemployment—has become a meaningful possibility (10%
probability). While more of a stretch (5% probability),
events could turn out better for the economy, since there is
evidence that underlying productivity growth is reviving.
Despite all the economy has had to deal with, odds are that
the current economic recovery will evolve into a self-
sustaining expansion. That is, by late this year, the economy
will return to full employment. This is consistent with an
unemployment rate in the low 3s and an employment-to-
population ratio for prime-age workers of over 80%. Real
GDP growth will throttle back to the economy’s potential
growth rate of near 2%. Inflation should also moderate back
to the Fed’s target of close to 2%, but this will take longer,
until late 2023. For this sanguine outlook to come to pass,
the pandemic must continue to fade—with each new wave
of the virus less disruptive to the economy than the one
before it—and the worst of the fallout from the Russian
invasion of Ukraine on oil and other commodity prices must
be at hand. It is critical that the Fed gets monetary policy
more or less right, which means quickly normalizing interest
rates over the next 18 months. We also need to catch a
break, so that nothing else goes materially wrong for the
economy.
While worries about the pandemic—and precautionary
efforts to contain the virus—have receded, the economy is
still struggling with its fallout. According to the Census
Bureau’s most recent pandemic-focused Pulse survey from
early February, close to 10 million workers said they were
not working because they were either sick, taking care of
someone who was, or fearful of getting sick. This goes a long
way to explain the near-record 11 million unfilled job
positions, a situation fanning wage and price pressures. It
stands to reason that as the pandemic winds down, people
will get back to work, positions will be filled, and wage
growth will moderate. Scrambled supply chains will also
untangle, easing shortages and prices. Some of the worst
bottlenecks have already been ironed out, but things have
gotten more complicated with the re-emergence of the
virus in China and other parts of Asia , where most supply
chains begin and pandemic responses are more restrictive.
By itself, the fallout of Russia’s invasion of Ukraine on the
U.S. economy should be modest. American businesses and
financial institutions have links to Russia , but in part because
of previously imposed sanctions on Russia resulting from its
takeover of Crimea those links are not consequential. The
principal link is through oil prices, as Russia accounts for just
over one-tenth of global oil production, including crude and
refined products, and a similar share of global oil exports,
totaling 7.5 million barrels per day. Prices have jumped more
than $30 per barrel to over $100 since a Russian invasion
looked possible late last year. This reflects the loss of
approximately 3 million barrels a day of Russian oil due to
an explicit U.S. ban on imports of Russian oil and self-
sanctioning by global energy companies. There is also a risk
premium in prices reflecting the possibility of even greater
disruptions. A handy rule of thumb is that every $10 -per-
barrel increase in oil prices results in a 30-cent increase in
the price of a gallon of regular unleaded, costing the typical
household $30 more per month to fill their tanks and

MOODY’S ANALYTICS CAPITAL MARKETS RESEARCH / WEEKLY MARKET OUTLOOK
4
costing households collectively about $35 billion more over
a year. The Russian invasion has thus lifted gas prices by
about $1 to a record $4.30 per gallon. While that is a
financial hit to households, cushioning the blow to the
broader economy is that the U.S. fossil fuel industry, which
vies with Saudi Arabia as the world’s largest, benefits. A $10 -
per-barrel increase in the price of oil thus shaves only 0.1%
from U.S. real GDP growth over the subsequent year. A $30 -
per-barrel increase, if sustained, will reduce real GDP by
0.3%. A modest impact.
This is our baseline outlook, as we assume that Russia finds a
way to stand down from its invasion, allowing hostilities to
abate by this time next year, and there are no greater
disruptions to Russian oil exports. Oil prices average about
$100 per barrel in coming months, then come down as U.S. ,
Saudi and UAE oil production increases in response. Along
with greater global inventory drawdowns, including releases
from U.S. and other nations' strategic petroleum reserves,
the missing Russian oil is replaced.
Of course, Russia’s invasion of Ukraine could take any of a
number of darker turns resulting in much more serious
economic consequences. Indeed, it is not difficult to
envisage a scenario in which the conflict intensifies, resulting
in even stiffer sanctions on Russia , including a European ban
on Russian oil imports. This would result in the loss of 5.4
million barrels a day of Russian oil, which would take much
longer to replace, and oil prices would spike even higher. Oil
prices closer to $150 per barrel would result for weeks if not
months, pushing U.S. gasoline prices to near $6 per gallon.
The previously provided rules of thumb would suggest that
GDP growth this year would be reduced by 0.8%. But this
surely understates the blow to the economy, as the much
higher oil prices and resulting inflation surge would
undermine already fragile consumer, business and investor
sentiment. Inflation expectations, already high, could be
completely dislodged. The Federal Reserve, faced with the
Hobson’s choice of responding to the struggling economy or
higher inflation, would likely ultimately decide to rein in the
inflation and inflation expectations. Policymakers will
appropriately figure that it is better to risk a near-term
recession than stagflation, which, based on the debilitating
experience with stagflation in the 1970s and early 1980s,
can only be dealt with by a much more severe downturn. As
long as Russia continues to pursue its invasion of Ukraine ,
recession and stagflation will be serious threats.
Whether the economic outlook will be characterized by a
self-sustaining expansion, recession or stagflation critically
depends on whether the Fed is able to calibrate the
normalization of interest rates. That is, raise rates fast
enough to sufficiently slow growth and quell inflation and
inflation expectations, but not so fast that it undermines
growth and the recovery. This will be tricky. Policymakers
have much work to do to get rates up to where they need to
be consistent with unemployment, inflation, inflation
expectations and financial conditions. These are the
measures in their so-called reaction function, which Fed
officials use to gauge where rates should be. Based on our
estimation of their reaction function, the funds rate should
be 2.5% and the Fed should be engaged in quantitative
tightening by allowing the Treasury and mortgage-backed
securities on its balance sheet to mature and prepay. For
context, 2.5% is policymakers’ estimate, as well as our own,
of the so-called equilibrium rate, or r-star—where the funds
rate should be in the long run. To be sure, the pandemic and
uncertainty created by the Russian invasion are good
reasons why the Fed has been slow to begin normalizing
policy. But policymakers now need to work quickly—though
not too quickly. No wonder recession and stagflation risks
are so uncomfortably high.
A prescient gauge of the economic outlook is the shape of
the Treasury yield curve. The curve as measured by the
difference between 10-year and two-year Treasury yields has
been especially accurate in predicting future recessions. Each

MOODY’S ANALYTICS CAPITAL MARKETS RESEARCH / WEEKLY MARKET OUTLOOK
5
time the curve has inverted in the past half-century—
meaning two-year yields have risen above 10-year yields—a
recession has soon followed. The thought is that the two-
year yield is a good barometer of what bond investors think
the Fed is going to do with rates. When investors believe the
Fed will raise rates aggressively, which will ultimately slow
growth and inflation, they sell two-year Treasuries, pushing
yields up, and purchase 10-year Treasuries, keeping a lid on
those yields.
When investors believe the Fed is going to push rates up too
quickly and tip the economy into recession, the curve
inverts. Right now, the curve remains positively sloped with
10-year yields higher than two-year yields, but not by much.
Of course, the curve already reflects investor expectations
that the Fed will aggressively raise rates and normalize them
by late 2023. This is similar to our baseline outlook.
Investors, like us, continue to believe in a self-sustaining
economic expansion. But also like us, they believe recession
risks are high.
Given all that has gone wrong over the two years since the
pandemic hit, it feels somewhat pollyannaish to argue that
there could be an upside surprise for the economy. But there
could be. Little noticed is the seeming revival in productivity
growth to near its long-run 2% per annum pace. The
shackles put on productivity growth since the financial crisis
have been broken, and the bounce in business investment
and business formations and the widespread adoption of
remote work during the pandemic augur well for even
stronger productivity gains dead ahead. There is no better
antidote for stagflation than stronger productivity, which
supports more growth and lower inflation. Of course, lots
has to go right for this upside surprise to happen. But we are
certainly due.

MOODY’S ANALYTICS CAPITAL MARKETS RESEARCH / WEEKLY MARKET OUTLOOK
6
The Week Ahead in the Global Economy
U.S.
We’ll see a packed week for U.S. economic data, and any
comments by Fed official will have the potential to rattle
financial markets. The Fed is sending a clear signal that it
may need to be more aggressive in removing monetary
policy accommodation. A 50 basis point rate hike is on the
table at the next couple of meetings, if the data cooperate.
The March employment report is due, and early indications
are that job growth remains solid. The unemployment rate
likely will have dipped from 3.8% to 3.7%. Even if March
employment was a dud, the Fed would likely look through
one month of data. What will catch its attention are
February headline and core PCE deflators. Fed Chair Jerome
Powell is looking for a noticeable deceleration in month-to-
month growth in consumer prices, but that likely didn’t
occur in February and will reaccelerate for March because of
the jump in global oil prices. We also get the Conference
Board’s Consumer confidence index for March, revisions to
fourth quarter GDP, monthly personal income and spending,
and initial claims for unemployment insurance benefits.
Europe
The euro zone’s preliminary estimate of the March HICP will
stand out in a busy week. We expect inflation to jump to 7%
y/y this March from 5.9% in February. Energy will be the
main driver. The military conflict in Ukraine has sent a shock
to commodity prices, which will show up first in the energy
segment and then pass to the food and core baskets. Food
prices will be growing strongly, continuing an upward trend
predating the conflict, as will those of core goods. Services
price growth will be relatively modest, since we don’t expect
a fuller recovery in the sector until this summer.
The conflict will also impose a shock to business and
consumer sentiment this month. We foresee the euro zone’s
Economic Sentiment Indicator dropping to 100 from 114
previously. There will be hits to consumer, industrial and, to
a lesser extent, services sectors. Each will be greatly
concerned about inflation; and industry will have an added
weight from a worsened view on inventories and supply, not
just to the conflict but also to lockdowns in China . Services,
namely tourism, may report weaker demand expectations
given the absence of Russian tourist flows for the
foreseeable future.
The euro zone unemployment rate was likely unchanged at
6.8% in February. Germany’s likely slid 0.1 ppt to 4.9%, but
we expect Italy’s was unchanged at 8.8%. As infections from
the Omicron wave of the pandemic fell and countries began
loosening social distancing measures, we expect an uptick in
hiring by services in anticipation for a more conducive
business environment. Since the pandemic was not
completely out of the picture, and we expect most post-
pandemic demand to be oriented toward services, retail
sales should grow tepidly for February. In France , household
consumption of goods likely rebounded 0.6% m/m, after a
prior 1.5% drop. In Germany , retail sales growth likely
slowed to 0.5% m/m from 2%, while in Spain we expect
they stabilized with zero growth, after pulling back in the
previous two months.
Russian retail sales likely grew 7.2% y/y in February,
speeding up from the previous month. The invasion of
Ukraine will eventually weigh heavily on the Russian
economy, but at the outset, retail sales will be pushed up as
consumer’s rushed to stockpile food and goods. Regarding
the unemployment rate, we are forecasting a small 0.1 ppt
increase to 4.5% from the previous month, not due to the
invasion but to underlying weakness reflected in the
month’s PMI releases. As for final estimates of fourth-
quarter GDP in France and the U.K. , we are not expecting
changes from the preliminary estimates of 0.7% and 1% q/q,
respectively. There is the risk, however, that consumption
was lower than initially forecast. For example, there was a
slight downward revision to December retail sales in France .
Asia-Pacific
Japan will release a suite of indicators for February. On
balance, we expect a softening given the Omicron wave of
COVID-19 subduing domestic demand, the challenging
external outlook including higher commodity prices, and the
ongoing semiconductor chip shortage. Industrial production
likely rose 0.5% m/m in February, partially recovering from
January’s 1.3% fall. We look for retail trade to fall 0.2% m/m
in February after the 1.9% slump in January. The pandemic
outlook has improved (daily new infections have declined),
but lingering virus concerns and elevated hospitalisations
will weigh on near-term household spending. The
unemployment rate likely held at 2.8% in February. The
Tankan survey diffusion index likely deteriorated to -2 in
March from 2 in December. Weak domestic demand and
higher commodity prices, especially for energy, have
clouded the outlook for manufacturers in the near term.
The Bank of Thailand will keep the policy rate steady at
0.5%. Inflation hit a 13-year high in February at 5.3% y/y
amid higher energy costs. Core CPI growth came in at more
modest 1.8%. The central bank is reluctant to begin
normalising policy settings despite upside risks to inflation
from high commodity prices.

MOODY’S ANALYTICS CAPITAL MARKETS RESEARCH / WEEKLY MARKET OUTLOOK
7
Geopolitical Calendar
Date
Country
Event
Economic
Importance
Financial Market Risk
28-29-Mar
ASEAN
U.S. -ASEAN summit
Low
Low
10-Apr
France
General elections
Medium
Medium
8-May
Hong Kong
Chief executive election
Low
Low
9-May
Philippines
Presidential election
Low
Low
29-May
Colombia
Presidential election
Medium
Low
Jun
Switzerland
World Economic Forum annual meeting
Medium
Low
29-30-Jun
NATO
NATO Summit, hosted by Madrid
Medium
Medium
Jun/Jul
PNG
National general election
Low
Low
2-Oct
Brazil
Presidential and congressional elections
High
Medium
Oct/Nov
China
National Party Congress
High
Medium
7-Nov
U.N .
U.N . Climate Change Conference 2022 (COP 27)
Medium
Low

MOODY’S ANALYTICS CAPITAL MARKETS RESEARCH / WEEKLY MARKET OUTLOOK
8
THE LONG VIEW: U.S.
Q2 GDP Expected to Rise 4.8% Annualized
BY RYAN SWEET
CREDIT SPREADS
Moody's long-term average corporate bond spread is 162
basis points, 4 bps wider than the 158 bps at this time last
week and wider than the 136 bps average in February. The
long-term average industrial corporate bond spread widened
by 3 bps to 147. It averaged 154 bps in February.
The recent ICE BofA U.S. high-yield option adjusted bond
spread is off its recent peak of 420 basis points as its now
closer to 370 bps. This is still well above that seen at the
beginning of the year, but the recent tightening is
encouraging. The Bloomberg Barclays high-yield option
adjusted spread has bounced around recently and is
currently 358 bps, compared with the 386 bs this time last
week. The high-yield option adjusted bond spreads
approximate what is suggested by the accompanying long-
term Baa industrial company bond yield spread and that
implied by a VIX of 23.
Defaults
The trailing 12-month global speculative-grade default rate
rose to 2% at the end of February from 1.8% in January. In
Europe , the default rate jumped to 2.1% from 1.2%. Under
our baseline scenario, Moody's Credit Transition Model
predicts that the global speculative-grade corporate default
rate will decline to 1.7% in the second quarter before rising
to 2.8% at the end of February 2023. That rate would still
be well below the long-term average of 4.1%.
Our baseline forecasts assume that the U.S. high-yield
spread will widen from about 400 basis points currently to
548 bps over the next four quarters. This widening would be
partially offset by improvement in the U.S. unemployment
rate, which we assume will decline to 3.5% by the end of
February 2023 from the current rate of 3.8%. Our baseline
forecasts are underpinned by positive factors such as good
corporate fundamentals, low refinancing risk in the near
term, and the transition of the global economy from a
tentative recovery toward more stable growth, bolstered by
improvement in the COVID-19 health situation. However,
risks have grown following the invasion of Ukraine and the
subsequent sanctions on Russia . Although we expect the Fed
to raise interest rates at a pace that will not severely disrupt
the U.S. economic recovery and financing conditions, the
Russia - Ukraine conflict could add substantial risk to the
default outlook through multiple channels, especially in
Europe .
U.S. Corporate Bond Issuance
First-quarter 2020’s worldwide offerings of corporate bonds
revealed annual advances of 14% for IG and 19% for high-
yield, wherein US$-denominated offerings increased 45%
for IG and grew 12% for high yield.
Second-quarter 2020’s worldwide offerings of corporate
bonds revealed annual surges of 69% for IG and 32% for
high-yield, wherein US$-denominated offerings increased
142% for IG and grew 45% for high yield.
Third-quarter 2020’s worldwide offerings of corporate
bonds revealed an annual decline of 6% for IG and an
annual advance of 44% for high-yield, wherein US$-
denominated offerings increased 12% for IG and soared
upward 56% for high yield.
Fourth-quarter 2020’s worldwide offerings of corporate
bonds revealed an annual decline of 3% for IG and an
annual advance of 8% for high-yield, wherein US$-
denominated offerings increased 16% for IG and 11% for
high yield.
First-quarter 2021’s worldwide offerings of corporate bonds
revealed an annual decline of 4% for IG and an annual
advance of 57% for high-yield, wherein US$-denominated
offerings sank 9% for IG and advanced 64% for high yield.
Issuance weakened in the second quarter of 2021 as
worldwide offerings of corporate bonds revealed a year-
over-year decline of 35% for investment grade. High-yield
issuance faired noticeably better in the second quarter.
Issuance softened in the third quarter of 2021 as worldwide
offerings of corporate bonds revealed a year-over-year
decline of 5% for investment grade. U.S. denominated
corporate bond issuance also fell, dropping 16% on a year-
ago basis. High-yield issuance faired noticeably better in the
third quarter.
Fourth-quarter 2021’s worldwide offerings of corporate
bonds fell 9.4% for investment grade. High-yield US$
denominated high-yield corporate bond issuance fell from
$133 billion in the third quarter to $92 billion in the final
three months of 2021. December was a disappointment for
high-yield corporate bond issuance, since it was 33% below
its prior five-year average for the month.
In the week ended March 18, US$-denominated high-yield
issuance totaled $1 billion , weaker than then $4 billion

MOODY’S ANALYTICS CAPITAL MARKETS RESEARCH / WEEKLY MARKET OUTLOOK
9
increase in the prior week. This brings the year-to-date total
to $52.5 billion . Investment-grade bond issuance rose $31.3
billion in the latest week, bringing its year-to-date total to
$427.5 billion . Total US$-denominated issuance is currently
tracking that seen in 2018 and 2019.
U.S. ECONOMIC OUTLOOK
There were some adjustments to our forecast between the
February and March baselines, as the latest incorporates
new assumptions around the effect of the military conflict
between Russia and Ukraine . There are many scenarios on
how the Russian invasion of Ukraine will unfold, each darker
than the next, but the most likely scenario is that Russian
troops will go no farther than Ukraine and any disruptions to
oil, natural gas and other commodity markets will be limited
and temporary. If so, the impact of the Russian invasion on
the U.S. economy will be on the margins.
The U.S. banking and trade exposure to either Russia or
Ukraine is very small. The primary channels through which
the military conflict will adversely impact the U.S. economy
is oil prices and financial market conditions. Europe’s
economy will be hit harder, but its economic recovery will
continue. Russia , however, will suffer a debilitating recession,
and for Ukraine’s economy this is a catastrophe.
Smaller fiscal package
President Biden renamed his economic agenda from “Build
Back Better” to “Building a Better America.” Prior to Biden’s
first State of the Union, we revised our BBA assumptions in
the March forecast. We no longer assume Democrats pass a
$1.2 trillion package of social safety net and climate policies
through budget reconciliation, but rather a $600 billion
legislation. We jettisoned the following two provisions that
had been included in the February forecast: $400 billion in
Affordable Care Act premium credits and $200 billion in
universal preschool investments.
The BBA package would pass by the end of the third quarter,
with implementation starting in the fourth quarter. It would
center around $330 billion in clean energy tax credits and
$230 billion in direct federal spending to address climate
change. The reconciliation bill would also modestly expand
the Child Tax Credit by $40 billion by making it fully
refundable on a permanent basis. The BBA would be a
virtual nonevent for the economy in 2022, but its gross
fiscal support would amount to 0.1% of GDP in 2023, peak
at 0.25% in 2026, and settle at less than 0.2% by the end of
a 10-year budget horizon.
Because we have rolled back the number of BBA
investments, the March forecast also assumes a smaller
number of pay-fors. We removed the following offsets that
were previously part of the February forecast: a new excise
tax applying to stock buybacks, higher taxes on global
intangible low-taxed income for U.S. multinationals, and
other international tax changes.
The March forecast still includes the following changes to
the personal tax code: ensuring high-income business
owners pay either the 3.8% Medicare tax or the 3.8% net
investment income tax and limiting business loss deductions
for noncorporate taxpayers. In addition, IRS funding would
increase to improve tax compliance. Finally, prescription
drug savings would solely come from repealing a Trump-era
rule eliminating safe harbor from a federal anti-kickback law
for rebates paid by pharmaceutical manufacturers to health
plans and pharmacy benefit managers in Medicare Part D.
We do not assume Democrats implement other prescription
drug reforms such as allowing the federal government to
negotiate drug prices in Medicare or requiring drug
companies to pay rebates when annual increases in drug
prices for Medicare and private insurance exceed the rate of
inflation.
In sum, the BBA would include $700 billion in tax increases
on well-to-do households, as well as prescription drug
savings. As a result, it would lead to a net deficit reduction
of $100 billion over the next 10 years. Our BBA assumption
in the March forecast is broadly in line with recent
comments by Senator Joe Manchin.
COVID-19 assumptions
We adjusted our epidemiological assumptions to anticipate
that total confirmed COVID-19 cases in the U.S. will be 81
million, less than the 82.9 million in the February baseline.
However, the number of assumed cases is still well above
that assumed before the Omicron variant. The seven-day
moving average of daily confirmed cases dropped sharply
recently and was around 39,000, below its recent peak of
807,000 and among the lowest since July. The date for
abatement of the pandemic, where total case growth is less
than 0.05% per day, changed slightly, as it has already
occurred. We had expected it to abate on April 4.
We have replaced the concept of herd immunity with
“effective immunity,” which is a rolling number of infections
plus vaccinations to account for the fact that immunity is
not permanent. The forecast still assumes that COVID-19
will be endemic and seasonal.
Oil bites into GDP
The March baseline factors in the recent jump in energy
prices, and that led us to revise our forecast lower for U.S.
GDP growth by 0.2 of a percentage point to 3.5% this year.
We nudged up the forecast for GDP growth in 2023 from
3% to 3.1%.
The bulk of the downward revision was in the second
quarter, when real GDP is expected to rise 4.8% at an

MOODY’S ANALYTICS CAPITAL MARKETS RESEARCH / WEEKLY MARKET OUTLOOK
10
annualized rate, compared with the 6.1% in the February
baseline forecast. We now expect oil prices to peak in the
second quarter, with West Texas Intermediate crude oil
prices averaging $100 per barrel. Our rule of thumb is that
every $10 increase in the per barrel price of oil increases U.S.
retail gasoline prices by 30 cents a gallon. Every penny
increase in retail gasoline prices reduces consumer spending
by about $1.5 billion over the course of a year.
GDP growth in the second half of this year will average 2.7%
at an annualized rate. The Bloomberg consensus is for real
GDP to increase 3.6% this year and 2.4% in 2023.
Oil prices, financial market conditions, inventories, and
global supply-chain issues remain downside risks to the
near-term forecast. While inventories played an enormous
role in the gain in fourth-quarter GDP, they are on track,
along with net exports, to be a significant drag on growth
early this year. Our high-frequency GDP model’s tracking
estimate of first-quarter GDP growth keeps heading south,
but it has nothing to do with recent geopolitical events.
Currently, first-quarter GDP is on track to rise 0.5% at an
annualized rate.
Business investment and housing
Fundamentals have turned less supportive for business
investment as corporate credit spreads continue to widen.
However, corporate profit margins are fairly wide, and banks
are easing lending standards.
We have real business equipment spending rising 7.3% this
year, compared with 8.2% in the February baseline. The
forecast is for real business equipment spending to increase
5.6% in 2023, a touch stronger than the 5.4% gain in the
February baseline forecast.
Risks are weighted to the downside for nonenergy business
investment, as financial markets could tighten more than we
anticipate and corporate credit spreads widen further. The
correlation coefficient between monthly changes in the
high-yield corporate bond spread and changes in the S&P
500 is -0.71 since 2000. The relationship is still strong if we
look at it on a weekly basis. Using no and various lags, the
Granger causality tests showed changes in the S&P 500
caused changes in the high-yield corporate bond spread. The
causal relationship runs in one direction.
The real nonresidential structures investment is now
expected to increase 14.4% this year, compared with the
11% gain in the February forecast. Some of the upward
revision is the boost to business investment from higher
energy prices, primarily in mining exploration, shafts and
wells. The Bureau of Economic Analysis uses the American
Petroleum Institute’s weighted average of footage drilled
along with rotary rig counts from Baker Hughes in its
current-quarter estimate of private fixed investment in
mining exploration, shafts and wells. This segment now
accounts for more than 10% of nominal private fixed
investment in nonresidential structures. Therefore, a rise in
energy prices would lead to an increase in the number of
active rotary rigs.
Separately, growth in the Commercial Property Price Index
was revised higher; it is now expected to increase 8.6% this
year, compared with 5.2% in the February baseline. We
raised the forecast next year from 2% to 7.7%.
Revisions to housing starts were small. Housing starts are
expected to be 1.81 million, compared with 1.84 million in
the February baseline. Revisions to housing starts next year
were also modest. Risks are heavily weighted to the
downside. There are likely only so many homes that can be
built each year because of labor-supply constraints and lack
of buildable lots. Some of the labor-supply issues will ease
as the pandemic winds down, but the reduction in
immigration is particularly problematic for homebuilders'
ability to find workers. Revisions to the forecast for new-
and existing-home sales this year were minor, as mortgage
rates haven’t risen either fast or high enough to cut
noticeably into sales.
We nudged up the forecast for the FHFA All-Transactions
House Price Index this year, with it rising 11.5%, compared
with 9.8% in the February baseline. House price growth
moderates noticeably in 2023, as prices are forecast to rise
2.3%, a touch weaker than the 2.4% in the February
baseline. This is attributable to rebalancing of supply and
demand.
Labor market
The February employment data are incorporated into the
March baseline forecast. They led to minor tweaks to the
forecast. We have job growth averaging 367,000 per month
this year, compared with the February baseline forecast of
384,000. There weren't material changes to the forecast for
the unemployment rate this year, as it is still expected to
average 3.4% in the final three months of this year and
3.4% in the fourth quarter of next year.
We assume a full-employment economy is one with a 3.5%
unemployment rate, around a 62.5% labor force
participation rate, and an 80% prime-age employment-to-
population ratio. All of these conditions will be met by late
this year or early next.
Fed sticks to its plan
Federal Reserve Chair Jerome Powell was explicit during his
semiannual testimony to the House Committee on Financial
Services. He took away all uncertainty about the outcome of
March’s Federal Open Market Committee meeting by

MOODY’S ANALYTICS CAPITAL MARKETS RESEARCH / WEEKLY MARKET OUTLOOK
11
throwing his support behind a 25-basis point rate hike and
saying that plans to reduce the size of the balance sheet will
not be finalized.
Normally, Fed chairs avoid tipping their hands, as it could be
seen as front-running the FOMC . However, Russia’s invasion
of Ukraine has caused a lot of volatility in financial markets
and created new uncertainty. Therefore, Powell likely
wanted to reduce any uncertainty about the Fed’s intention
at its upcoming meeting. Powell did leave the door open for
larger rate hikes at future meetings.
He sounded optimistic that the Fed can engineer a soft
landing, where it raises interest rates enough to curb
inflation but not enough to tip the economy into recession.
Powell floated the idea that this tightening cycle will end
above his estimate of the neutral fed funds rate of 2% to
2.5%.
We maintained our assumption that the Fed raises the
target range for the fed funds rate four times this year, 25
basis points each time. Markets are pricing in more hikes,
just south of seven hikes over the next 12 months. The
tightening in financial market conditions did some of the
Fed’s work for it. The primary channel through which
monetary policy impacts the economy is financial markets.
With financial market conditions tightening, the Fed doesn’t
need to do as much this year.
The Fed is also expected to begin quantitative tightening
this summer. That is, the central bank will not replace the
Treasury and mortgage securities it owns as they mature or
prepay, allowing its balance sheet to slowly shrink, and
putting upward pressure on longer-term rates.
Risks are weighted toward more rate hikes this year. Higher
energy prices are going to cause inflation to peak higher
than we had previously expected. We look for year-over-
year growth in the consumer price index to be 7.4% in the
first quarter, compared with 7% in the February baseline.
The inflation forecast follows a similar trajectory as past
baseline forecasts, just higher. Inflation moderates through
the remainder of the year, returning to the Fed’s target in
the first half of next year. Key to this forecast is that oil
prices average $100 per barrel in the second quarter, with
that being the peak. Also, supply-chain issues are expected
to ease, leading to significant disinflation in goods prices.
We didn’t make significant changes to the forecast for the
10-year Treasury yield. The forecast is that the Dow Jones
Industrial Average incorporates the recent developments.
The new baseline will have the Dow Jones Industrial Average
lower than its February baseline. The recent decline
accounted for the bulk of the decline we expected to occur
throughout the year. Therefore, the March baseline has
another leg lower in equity prices, which we expect will
remain within a tight range through the end of next year.

MOODY’S ANALYTICS CAPITAL MARKETS RESEARCH / WEEKLY MARKET OUTLOOK
12
THE LONG VIEW: EUROPE
Invasion Exacerbates Inflation Across Continent
BY ROSS CIOFFI
The Russian invasion of Ukraine has exacerbated inflation
across Europe and worsened an already elevated cost-of-
living crisis in Spain . Surging energy costs have triggered
protests by truck drivers, fishermen and farmers, who are all
on the front line of rapidly increasing fuel prices. Households
and businesses across the country are also facing soaring
fuel and electricity bills. The situation in Spain is among the
most acute in the euro zone given the prevalence of variably
rated utility contracts in the country. The government has
already rolled over VAT cuts on utilities, initially debuted
last fall. It plans to unveil another relief package on March
29 with more direct measures. The government agreed this
past Monday on an aid package of €500 million to help with
transporters' fuel costs.
Germany’s government, meanwhile, announced another set
of measures on Thursday aimed at alleviating rising energy
costs. These include a €300 rebate to all taxpayers and an
extra €100 for child support, a three-month reduction in
taxes on fuels, and a three-month cost reduction for
monthly public transport tickets. These come on top of
similar measures announced a month ago, the total of
which could cost around €30 billion (there have not been
precise estimates of costs yet).
European PMIs outperform expectations
The flash estimate of the euro zone’s March PMI beat our
expectations. The reading for the composite index slumped
modestly to 54.5 from 55.5 in February. We were not
expecting the surveys to signal a contraction in activity
(reflected by a below-50 reading), but we did suspect the
reading might fall more significantly. Ultimately, with
COVID-19 restrictions easing, demand got a boost,
particularly for services. The military conflict in Ukraine has
worsened global supply conditions, though, which had a
worse effect on the manufacturing PMI. That said, services
and manufacturing surveys reported significant inflation
pressures and faltering confidence. The flash reading of the
manufacturing survey fell to 57 from 58.2 previously, while
the services reading inched lower to 54.8 from 55.5.
The U.K.’s composite PMI reading did even better, falling just
0.2 percentage point to 59.7 in March. The details of the
survey were similar, given the effects of the Russian invasion
of Ukraine on global supply conditions and prices. However,
the services PMI increased during the month, supported by a
wave of post-pandemic demand. The services PMI reading
rose to 61 from 60.5 a month earlier, while the
manufacturing PMI fell to 55.5 from 58 previously. The flash
readings for the euro zone and the U.K. support our view of
continued stability in labor markets, struggling output
despite resilient demand, and a continued acceleration in
inflation in the first quarter.
Swiss National Bank holds rates steady
The Swiss National Bank maintained its policy rate at -
0.75% at its March meeting. The inflation rate rose above
target to 2.2% y/y in February on the back of higher oil
prices and global supply bottlenecks. The SNB upwardly
revised its 2022 inflation forecast to 2.1%. A strong franc is
mitigating inflation pressures, however. The monetary
authority maintained its commitment to intervene in
foreign exchange markets to limit appreciation. The SNB
expects the inflation rate to fall back below target to 0.9%
in 2023 and 2024, so the currently more expansionary
policy stance is still in line with the bank’s mandate for price
stability and economic growth. Our March baseline foresees
a similar path for inflation, expecting no rate hikes in the
short term.
Norges Bank hikes
The Norges Bank raised the sight deposit rate by 25 basis
points to 0.75%. Policymakers are battling headline and core
inflation, both of which are above target as of the February
release (3.7% y/y and 2.1%, respectively). Inflation pressures
on producers and consumers will remain strong in the form
of elevated input and energy prices due to global supply
disruptions and the military conflict in Ukraine . But on top
of this, wage inflation has been stronger than anticipated,
which has pushed up prospects for robust inflation in the
medium term. We expect policymakers will act on their
guidance and respond with another rate hike in June; the
bank’s forward guidance furthermore specified hikes
culminating in a 2.5% policy rate by the end of 2023.
.

MOODY’S ANALYTICS CAPITAL MARKETS RESEARCH / WEEKLY MARKET OUTLOOK
13
THE LONG VIEW: ASIA-PACIFIC
Singapore Inflation Soars
BY DENISE CHEOK and HERON LIM
Singapore’s headline inflation soared to 4.3% in February, the
largest increase since February 2013. Much of the rise was due
to an increase in car prices caused by higher taxes rather than
supply-chain issues. Core inflation, which excludes
accommodation and private transportation, saw a slower rate
of increase compared with the previous month’s reading.
Prices of food and energy increased at a slower rate than in
January, although downside risks still abound. Singapore
imports almost all of its fresh food and energy, making it
highly susceptible to external shocks.
The Russian invasion of Ukraine has pushed oil prices above
$100 per barrel, and we expect energy prices to stay high in
the first half of the year. This should ease in the second half,
which will quell inflation pressures in countries including
Singapore . Supply-chain disruptions from the COVID-19
pandemic are ongoing as well. Although most of the world
has transitioned to living with the virus; China is a notable
exception. Several key Chinese cities such as Shenzhen were
locked down because of COVID-19 outbreaks. The country is
unlikely to relax its stance against the virus in coming months,
and this will weigh heavily on global supply chains.
The Monetary Authority of Singapore noted that core
inflation “could reach 3% by the middle of the year” before
easing in the latter half. This will bring core inflation near the
upper bound of the central bank’s projection of 2% to 3%.
February’s CPI reading is the last before the MAS meets next
month. With headline inflation exceeding the central bank’s
projections for the fourth straight month, we expect to see
further tightening of monetary policy at the April meeting.
…While Hong Kong’s inflation remains subdued
Hong Kong’s headline composite consumer price index rose
by 1.6% over the year in February, a 0.4-percentage point
increase from January. After netting out the effect of one-off
relief measures, consumer prices still saw a year-on-year
increase of 1.6% in February. This was expected because
demand-side pressures were subdued by tightened social
distancing measures designed to keep an outbreak of the
Omicron variant of COVID-19 in check. There was reduced
demand in consumer services and the housing market. The
housing market plays an oversize role in Hong Kong’s CPI,
making up more than 40% of the current CPI basket, and
weaknesses in the housing market, which saw a 0.3%
decrease over the year, will lead to softer CPI increases
overall.
However, prices increased in other categories. Clothing and
footwear saw the biggest spike over the year at 8%, while
transport and food prices increased 8% and 3.6%,
respectively. Even though the headline inflation rate is
relatively low compared with regional peers such as
Singapore and Taiwan , Hong Kong has not been immune to
the inflation tailwinds caused by climbing commodity and
energy prices.
Hong Kong’s zero-COVID policy has put significant strain on
its healthcare system as the city deals with its worst virus
surge. However, Hong Kong has seen a steep decline in new
cases since early March. Officials are looking to gradually lift
restrictions from April.
Still, there are headwinds to inflation. The housing market is
expected to remain subdued in the near term, as demand
from Mainland China is expected to remain soft for 2022 (a
reopening with China is still in the works with no set date at
the time of writing). We also see interest rate normalisation
by U.S. Federal Reserve increasing borrowing costs within
Hong Kong ; borrowing rates in Hong Kong largely reflect
those in the U.S. due to the hard currency peg. This will
reduce consumption activity and keep overall consumer
inflation slow. We currently expect the annual inflation rate
to reach 2.8% for 2022.

MOODY’S ANALYTICS CAPITAL MARKETS RESEARCH / WEEKLY MARKET OUTLOOK
14
RATINGS ROUNDUP
Europe Changes Turn Overwhelmingly Positive
BY STEVEN SHIELDS
U.S.
U.S. corporate credit quality improved in the latest period
with credit upgrades accounting for nearly two-thirds of
changes and 60% of the affected debt. The changes
spanned a diverse set of industrial groups with investment-
grade firms accounting for three of the seven upgrades.
Endeavor Energy Resources L.P. was the largest change in
terms of total debt affected at $1.6 billion . Moody’s
Investors Service raised Endeavor’s senior unsecured notes
to Ba2 from Ba3, raised its Corporate Family Rating to Ba1
from Ba2, and revised the outlook to stable from positive.
The upgrade reflects Endeavor's increased scale, reduced
debt balance and our expectation of continued growth and
free cash flow generation under favorable price conditions
through 2023.
Meanwhile, Toll Road Investors Partnership II L.P. and Jets
Stadium Development LLC both received an upgrade on
their respective senior unsecured notes to A1. Moody’s
Investors Service lowered TPC Group Inc.’s first lien priming
notes to B3 from B2, first lien notes to Caa3 from Caa2, and
its CFR to Caa3 from Caa1. The downgrade follows TPC’s
forbearance agreement in early February after a missed
interest payment. The CFR downgrade to Caa3 reflects the
fact that in bankruptcy, noteholders could be required to
take a meaningful haircut to outstanding debt at TPC, given
the uncertainty over future cash outflows related to the
explosion and fire at TPC's Port Neches facility in November
2019. It also reflects Moody's view of an average recovery on
TPC's debt given the value of the business and the potential
proceeds from its insurance policies. While the company's
financial performance has been unusually weak since the
pandemic, Moody's expects a meaningful recovery in 2022
due to higher C4 Processing volumes owing to ongoing
improvements at its facilities, and increased profitability in
the Performance Products segment.
Europe
Ratings activity was once again elevated across Western
Europe with the region receiving 44 rating changes in the
period. However, unlike the previous week, activity was
overwhelmingly positive. All but four of the changes
occurred to firms located within the United Kingdom . The
change reflects Moody’s recent upgrade of Assured
Guaranty and its subsidiaries following the resolution of the
group’s exposure to the general obligation bonds issued by
the Commonwealth of Puerto Rico . As a result, Moody’s
ratings on securities that are guaranteed or “wrapped” by
Assured Guaranty were also upgraded.
.
MOODY’S ANALYTICS CAPITAL MARKETS RESEARCH / WEEKLY MARKET OUTLOOK
15
RATINGS ROUND-UP
0.0
0.2
0.4
0.6
0.8
1.0
0.0
0.2
0.4
0.6
0.8
1.0
Apr01
Aug04
Dec07
Apr11
Aug14
Dec17
Apr21
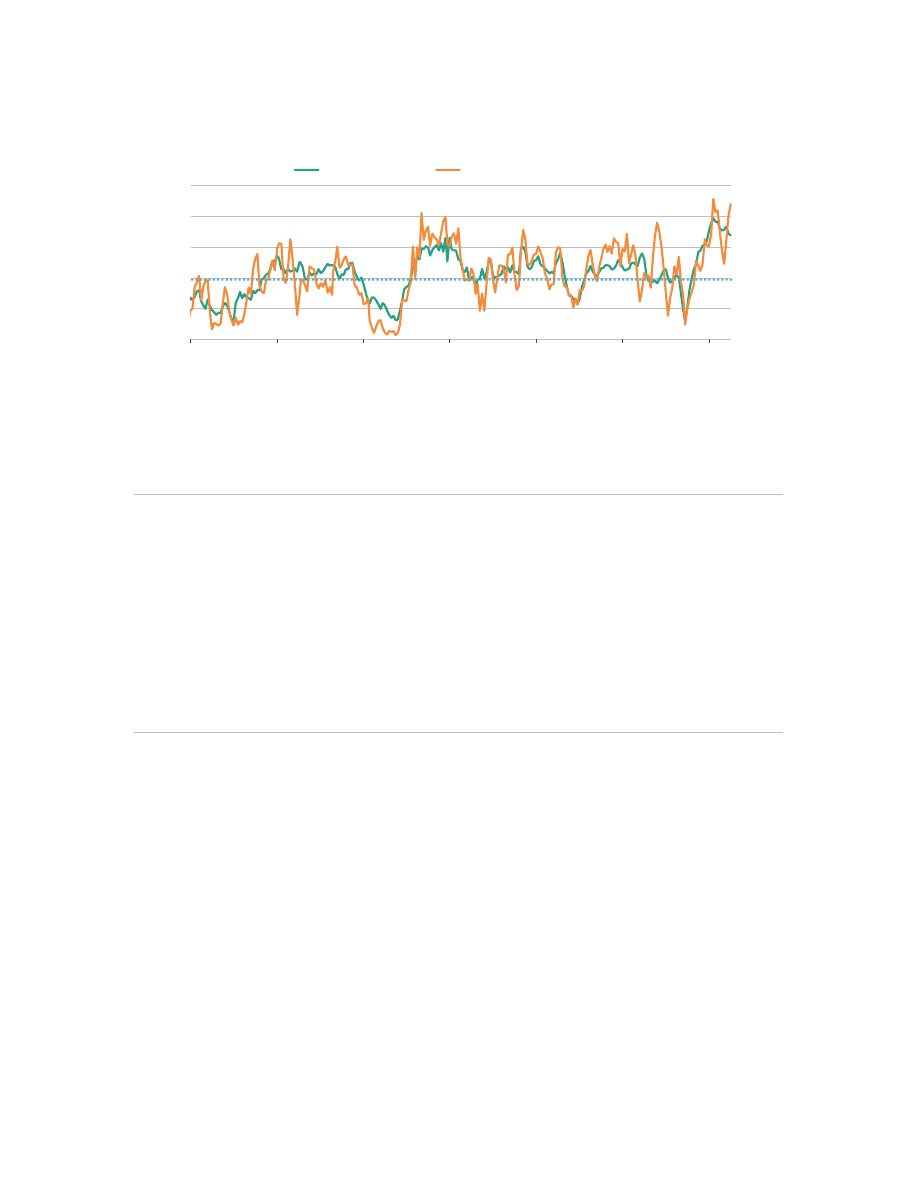
FIGURE 1
Rating Changes - US Corporate & Financial Institutions: Favorable as a % of Total Actions
By Count of Actions
By Amount of Debt Affected
* Trailing 3-month average
Source: Moody's
FIGURE 2
BCF
Bank Credit Facility Rating
MM
Money-Market
CFR
Corporate Family Rating
MTN
MTN Program Rating
CP
Commercial Paper Rating
Notes
Notes
FSR
Bank Financial Strength Rating
PDR
Probability of Default Rating
IFS
Insurance Financial Strength Rating
PS
Preferred Stock Rating
IR
Issuer Rating
SGLR
Speculative-Grade Liquidity Rating
JrSub
Junior Subordinated Rating
SLTD
Short- and Long-Term Deposit Rating
LGD
Loss Given Default Rating
SrSec
Senior Secured Rating
LTCF
Long-Term Corporate Family Rating
SrUnsec
Senior Unsecured Rating
LTD
Long-Term Deposit Rating
SrSub
Senior Subordinated
LTIR
Long-Term Issuer Rating
STD
Short-Term Deposit Rating
Rating Key

MOODY’S ANALYTICS CAPITAL MARKETS RESEARCH / WEEKLY MARKET OUTLOOK
16
FIGURE 3
Rating Changes: Corporate & Financial Institutions - US
Date
Company
Sector
Rating
Amount
($ Million)
Up/
Down
Old
LTD
Rating
New LTD
Rating
IG/S
G
3/17/2022
WW INTERNATIONAL, INC.
Industrial
SrSec/BCF/LTCFR/PDR
500.00
D
Ba3
B1
SG
3/17/2022
GREIF, INC.
Industrial
LTCFR/PDR
U
Ba2
Ba1
SG
3/18/2022
TOLL ROAD INVESTORS PARTNERSHIP II, L.P. Industrial
SrUnsec
571.10
U
A2
A1
IG
3/18/2022
JETS STADIUM DEVELOPMENT, LLC
Industrial
SrUnsec
455.00
U
A2
A1
IG
3/18/2022
BROOKLYN ARENA LOCAL DEVELOPMENT
CORPORATION
Industrial
SrSec
U
A2
A1
IG
3/18/2022
GOGO INC.
Industrial
SrSec/BCF/LTCFR/PDR
U
B3
B2
SG
3/18/2022
HORIZON THERAPEUTICS PLC-HORIZON
THERAPEUTICS USA , INC.
Industrial
SrUnsec/LTCFR/PDR
600.00
U
Ba3
Ba2
SG
3/21/2022
TPC GROUP INC.
Industrial
SrSec/LTCFR/PDR
1083.00
D
B2
B3
SG
3/22/2022
ENDEAVOR ENERGY RESOURCES, L.P.
Industrial
SrUnsec/LTCFR/PDR
1600.00
U
Ba3
Ba2
SG
3/22/2022
KINDER MORGAN, INC. -RUBY PIPELINE, LLC Industrial
SrUnsec/LTCFR/PDR
693.75
D
Caa1
Ca
SG
3/22/2022
JHW CJF TOPCO, INC.-ALPHIA, INC.
Industrial
SrSec/BCF/LTCFR/PDR
D
B2
Caa1
SG
Source: Moody's

MOODY’S ANALYTICS CAPITAL MARKETS RESEARCH / WEEKLY MARKET OUTLOOK
17
FIGURE 4
Rating Changes: Corporate & Financial Institutions - Europe
Date
Company
Sector
Rating
Amount
($ Million)
Up/
Down
Old
LTD
Rating
New
LTD
Rating
O
l
d
e
w
IG/
SG
Country
3/18/2022
KELDA GROUP LIMITED- YORKSHIRE WATER
SERVICES FINANCE LIMITED
Utility
SrSec
447.61
U
A2
A1
IG UNITED KINGDOM
3/18/2022
AUTOLINK CONCESSIONAIRES (M6) PLC
Industrial
SrSec
171.88
U
A2
A1
IG UNITED KINGDOM
3/18/2022
STIRLING WATER SEAFIELD FINANCE PLC
Utility
SrSec
141.72
U
A2
A1
IG UNITED KINGDOM
3/18/2022
WORCESTERSHIRE HOSPITAL SPC PLC
Industrial
SrSec
133.87
U
A2
A1
IG UNITED KINGDOM
3/18/2022
CRITERION HEALTHCARE PLC
Industrial
SrSec
89.03
U
A2
A1
IG UNITED KINGDOM
3/18/2022
ENDEAVOUR SCH PLC
Industrial
SrSec
189.37
U
A2
A1
IG UNITED KINGDOM
3/18/2022
HPC KING'S COLLEGE HOSPITAL (ISSUER)
PLC
Industrial
SrSec
127.31
U
A2
A1
IG UNITED KINGDOM
3/18/2022
BAGLAN MOOR HEALTHCARE PLC
Industrial
SrSec
90.83
U
A2
A1
IG UNITED KINGDOM
3/18/2022
SUTTON AND EAST SURREY WATER PLC
Utility
SrSec
137.73
U
A2
A1
IG UNITED KINGDOM
3/18/2022
DWR CYMRU (HOLDINGS) LIMITED-DWR
CYMRU (FINANCING) UK PLC
Utility
SrSec
1101.81
U
A2
A1
IG UNITED KINGDOM
3/18/2022
ELLENBROOK DEVELOPMENTS PLC
Industrial
SrSec
82.59
U
A2
A1
IG UNITED KINGDOM
3/18/2022
INVESTORS IN THE COMMUNITY ( BUXTON )
LTD
Industrial
SrSec
89.21
U
A2
A1
IG UNITED KINGDOM
3/18/2022
FRIGOGLASS SAIC
Industrial
SrSec/LTCFR/PDR
302.81
D
Caa1
Caa2
SG NETHERLANDS
3/18/2022
ENTERPRISE CIVIC BUILDINGS LIMITED
Industrial
SrSec
29.58
U
A2
A1
IG UNITED KINGDOM
3/18/2022
HOSPITAL COMPANY ( DARTFORD ) ISSUER
PLC (THE)
Industrial
SrSec
210.07
U
A2
A1
IG UNITED KINGDOM
3/18/2022
MOYLE INTERCONNECTOR (FINANCING)
PLC
Utility
SrSec
185.94
U
A2
A1
IG UNITED KINGDOM
3/18/2022
DERBY HEALTHCARE PLC
Industrial
SrSec
615.07
U
A2
A1
IG UNITED KINGDOM
3/18/2022
CATALYST HEALTHCARE ( ROMFORD )
FINANCING PLC
Industrial
SrSec/BCF
176.84
U
A2
A1
IG UNITED KINGDOM
3/18/2022
OCTAGON HEALTHCARE FUNDING PLC
Industrial
SrSec
421.89
U
A2
A1
IG UNITED KINGDOM
3/18/2022
UNITED HEALTHCARE ( BROMLEY ) LIMITED
Industrial
SrSec
190.66
U
A2
A1
IG UNITED KINGDOM
3/18/2022
HOSPITAL COMPANY (QAH PORTSMOUTH )
LIMITED
Industrial
SrSec/BCF
U
A2
A1
IG UNITED KINGDOM
3/18/2022
CENTRAL NOTTINGHAMSHIRE HOSPITALS
PLC
Industrial
SrSec
484.66
U
A2
A1
IG UNITED KINGDOM
3/18/2022
CAPITAL HOSPITALS (ISSUER) PLC
Industrial
SrSec/BCF
702.68
U
A2
A1
IG UNITED KINGDOM
3/18/2022
ARTESIAN FINANCE III PLC
Utility
SrSec
153.43
U
A2
A1
IG UNITED KINGDOM
3/18/2022
HIGHWAY MANAGEMENT (CITY) FINANCE
PLC
Industrial
SrSec/BCF
101.50
U
A2
A1
IG UNITED KINGDOM
3/18/2022
ASPIRE DEFENCE FINANCE PLC
Industrial
SrSec
1007.57
U
A2
A1
IG UNITED KINGDOM
3/18/2022
CATALYST HIGHER EDUCATION ( SHEFFIELD )
PLC
Industrial
SrSec
215.95
U
A2
A1
IG UNITED KINGDOM
3/18/2022
NEWHOSPITALS ( ST. HELENS AND
KNOWSLEY) FINANCE PLC
Industrial
SrSec/BCF
236.20
U
A2
A1
IG UNITED KINGDOM
3/18/2022
INSPIRED EDUCATION (SOUTH
LANARKSHIRE ) PLC
Industrial
SrSec
485.14
U
A2
A1
IG UNITED KINGDOM
3/18/2022
HOSPITAL COMPANY ( SWINDON AND
MARLBOROUGH) LTD
Industrial
SrSec
220.36
U
A2
A1
IG UNITED KINGDOM
3/18/2022
COVENTRY AND RUGBY HOSPITAL
COMPANY PLC (THE)
Industrial
SrSec
560.87
U
A2
A1
IG UNITED KINGDOM
3/18/2022
HEALTHCARE SUPPORT (NORTH STAFFS )
FINANCE PLC
Industrial
SrSec/BCF
261.70
U
A2
A1
IG UNITED KINGDOM
3/18/2022
CHANNEL LINK ENTERPRISES FINANCE PLC
Industrial
SrSub
584.38
U
A2
A1
IG UNITED KINGDOM
3/18/2022
WALSALL HOSPITAL COMPANY PLC
Industrial
SrSec
220.84
U
A2
A1
IG UNITED KINGDOM
3/18/2022
AUTOVIA DE LA MANCHA S.A.
Industrial
SrSec/BCF
U
A2
A1
IG SPAIN
3/18/2022
OSPREY ACQUISITIONS LIMITED-ANGLIAN
WATER SERVICES FINANCING PLC
Utility
SrSec
495.81
U
A2
A1
IG UNITED KINGDOM
3/18/2022
HOLYROOD STUDENT ACCOMMODATION
PLC
Industrial
SrSec
86.78
U
A2
A1
IG UNITED KINGDOM
3/18/2022
SUSTAINABLE COMMUNITIES FOR LEEDS
(FINANCE) PLC
Industrial
SrSec
140.25
U
A2
A1
IG UNITED KINGDOM
3/18/2022
SOLUTIONS 4 NORTH TYNESIDE (FINANCE)
PLC
Industrial
SrSec
105.55
U
A2
A1
IG UNITED KINGDOM
3/18/2022
S4B (ISSUER) PLC
Industrial
SrSec
101.26
U
A2
A1
IG UNITED KINGDOM
3/18/2022
SCOTIA GAS NETWORKS LIMITED-
SCOTLAND GAS NETWORKS PLC
Utility
SrUnsec
743.72
U
A2
A1
IG UNITED KINGDOM
3/18/2022
SBANKEN ASA
Financial
LTD/MTN
U
A2
Aa2
IG NORWAY
3/18/2022
QAH FINANCE PLC
Industrial
SrSec
451.02
U
A2
A1
IG UNITED KINGDOM
3/21/2022
WEPA HYGIENEPRODUKTE GMBH
Industrial
SrSec/LTCFR/PDR
698.79
D
B1
B2
SG GERMANY
Source: Moody's

MOODY’S ANALYTICS CAPITAL MARKETS RESEARCH / WEEKLY MARKET OUTLOOK
18
MARKET DATA
0
200
400
600
800
0
200
400
600
800
2003 2004 2005 2006 2007 2008 2009 2010 2011 2012 2013 2014 2015 2016 2017 2018 2019 2020 2021 2022
Spread (bp)
Spread (bp)
Aa2
A2
Baa2
Source: Moody's
Figure 1: 5-Year Median Spreads-Global Data (High Grade)
0
400
800
1,200
1,600
2,000
0
400
800
1,200
1,600
2,000
2003 2004 2005 2006 2007 2008 2009 2010 2011 2012 2013 2014 2015 2016 2017 2018 2019 2020 2021 2022
Spread (bp)
Spread (bp)
Ba2
B2
Caa-C
Source: Moody's
Figure 2: 5-Year Median Spreads-Global Data (High Yield)

MOODY’S ANALYTICS CAPITAL MARKETS RESEARCH / WEEKLY MARKET OUTLOOK
19
CDS MOVERS
CDS Implied Rating Rises
Issuer
Mar. 23
Mar. 16
Senior Ratings
Abbott Laboratories
Aa2
A1
A1
JPMorgan Chase & Co.
Baa1
Baa2
A2
Citigroup Inc.
Baa2
Baa3
A3
Goldman Sachs Group, Inc. (The)
Baa2
Baa3
A2
Wells Fargo & Company
Baa1
Baa2
A1
JPMorgan Chase Bank, N.A.
A3
Baa1
Aa2
Comcast Corporation
A2
A3
A3
Oracle Corporation
Baa2
Baa3
Baa2
CVS Health Corporation
A1
A2
Baa2
Exxon Mobil Corporation
Aa1
Aa2
Aa2
CDS Implied Rating Declines
Issuer
Mar. 23
Mar. 16
Senior Ratings
CenterPoint Energy, Inc.
Baa2
A3
Baa2
PepsiCo, Inc.
A2
A1
A1
Philip Morris International Inc.
A2
A1
A2
General Electric Company
Baa3
Baa2
Baa1
Eli Lilly and Company
Aa2
Aa1
A2
FirstEnergy Corp.
Baa3
Baa2
Ba1
Emerson Electric Company
Baa1
A3
A2
Danaher Corporation
A3
A2
Baa1
Archer-Daniels-Midland Company
A2
A1
A2
United Rentals ( North America ), Inc.
Ba2
Ba1
Ba2
CDS Spread Increases
Issuer
Senior Ratings
Mar. 23
Mar. 16
Spread Diff
Talen Energy Supply, LLC
Caa2
10,691
7,717
2,973
American Airlines Group Inc.
Caa1
1,192
1,014
178
United Airlines Holdings, Inc.
Ba3
728
637
91
Liberty Interactive LLC
B2
761
703
58
Goodyear Tire & Rubber Company (The)
B2
432
387
45
Macy's Retail Holdings, LLC
Ba2
360
325
35
American Axle & Manufacturing, Inc .
B2
525
493
32
Embarq Corporation
Ba2
315
285
30
Xerox Corporation
Ba2
358
330
28
Beazer Homes USA, Inc.
B3
469
446
24
CDS Spread Decreases
Issuer
Senior Ratings
Mar. 23
Mar. 16
Spread Diff
Nabors Industries, Inc .
Caa2
502
583
-82
Staples, Inc.
Caa2
1,231
1,311
-80
Rite Aid Corporation
Caa2
1,356
1,412
-56
Murphy Oil Corporation
Ba3
263
318
-54
Nissan Motor Acceptance Company LLC
Baa3
247
275
-28
Avis Budget Car Rental, LLC
B2
332
357
-26
Tenet Healthcare Corporation
B3
281
302
-21
Travel + Leisure Co.
B1
217
237
-21
Occidental Petroleum Corporation
Ba1
129
149
-20
Calpine Corporation
B2
424
444
-19
Source: Moody's, CMA
CDS Spreads
CDS Implied Ratings
CDS Implied Ratings
CDS Spreads
Figure 3. CDS Movers - US ( March 16, 2022 – March 23, 2022)

MOODY’S ANALYTICS CAPITAL MARKETS RESEARCH / WEEKLY MARKET OUTLOOK
20
CDS Movers
CDS Implied Rating Rises
Issuer
Mar. 23
Mar. 16
Senior Ratings
ASML Holding N.V.
Aa2
A1
A2
UniCredit Bank AG
A2
A3
A2
ENEL S.p.A .
Baa2
Baa3
Baa1
Anheuser-Busch InBev SA /NV
A3
Baa1
Baa1
Heineken N.V.
Aa1
Aa2
Baa1
Telia Company AB
A1
A2
Baa1
Iberdrola International B.V .
A3
Baa1
Baa1
Veolia Environnement S.A.
A2
A3
Baa1
Autoroutes du Sud de la France (ASF)
A2
A3
A3
National Grid Electricity Transmission plc
A2
A3
Baa1
CDS Implied Rating Declines
Issuer
Mar. 23
Mar. 16
Senior Ratings
Spain , Government of
Aa3
Aa2
Baa1
NatWest Markets Plc
Baa1
A3
A2
Swedbank AB
A2
A1
Aa3
Landesbank Hessen-Thueringen GZ
Aa3
Aa2
Aa3
SEB AB
A1
Aa3
Aa3
EnBW Energie Baden-Wuerttemberg AG
A3
A2
Baa1
thyssenkrupp AG
Ba3
Ba2
B1
Coca-Cola HBC Finance B.V .
A3
A2
Baa1
NatWest Markets N.V .
Aa2
Aa1
A2
adidas AG
Aa3
Aa2
A2
CDS Spread Increases
Issuer
Senior Ratings
Mar. 23
Mar. 16
Spread Diff
Vue International Bidco plc
Ca
1,122
835
287
Banco Comercial Portugues, S.A.
Ba1
252
205
47
thyssenkrupp AG
B1
306
259
47
Casino Guichard-Perrachon SA
Caa1
956
911
45
Sappi Papier Holding GmbH
Ba2
353
333
19
Valeo S.E.
Baa3
243
227
16
Piraeus Financial Holdings S.A.
Caa2
698
684
14
Renault S.A.
Ba2
308
295
14
Ziggo Bond Company B.V .
B3
306
292
14
TDC Holding A/S
B2
186
172
14
CDS Spread Decreases
Issuer
Senior Ratings
Mar. 23
Mar. 16
Spread Diff
Boparan Finance plc
Caa1
1,758
2,100
-341
Novafives S.A.S.
Caa2
1,041
1,092
-51
Vedanta Resources Limited
B3
856
900
-44
UPC Holding B.V.
B3
205
230
-25
Fortum Oyj
Baa2
195
213
-19
Banca Monte dei Paschi di Siena S.p.A .
Caa1
463
477
-14
Hammerson Plc
Baa3
187
200
-13
FCE Bank plc
Baa3
182
191
-9
Deutsche Lufthansa Aktiengesellschaft
Ba2
309
316
-7
Jaguar Land Rover Automotive Plc
B1
552
559
-7
Source: Moody's, CMA
CDS Spreads
CDS Implied Ratings
CDS Implied Ratings
CDS Spreads
Figure 4. CDS Movers - Europe ( March 16, 2022 – March 23, 2022)

MOODY’S ANALYTICS CAPITAL MARKETS RESEARCH / WEEKLY MARKET OUTLOOK
21
CDS Movers
CDS Implied Rating Rises
Issuer
Mar. 23
Mar. 16
Senior Ratings
Nippon Yusen Kabushiki Kaisha
A1
Baa1
Ba3
JFE Holdings, Inc.
Aa3
A2
Baa3
Honda Motor Co., Ltd.
Aa1
Aa3
A3
Indonesia , Government of
Baa2
Baa3
Baa2
Export-Import Bank of Korea (The)
Aa1
Aa2
Aa2
China Development Bank
Baa1
Baa2
A1
Export-Import Bank of China (The)
A3
Baa1
A1
SoftBank Group Corp.
B1
B2
Ba3
Chubu Electric Power Company, Incorporated
Aa1
Aa2
A3
Industrial & Commercial Bank of China Ltd
Baa1
Baa2
A1
CDS Implied Rating Declines
Issuer
Mar. 23
Mar. 16
Senior Ratings
Westpac Banking Corporation
A2
A1
Aa3
National Australia Bank Limited
A1
Aa3
Aa3
Commonwealth Bank of Australia
A1
Aa3
Aa3
DBS Bank Ltd.
A1
Aa3
Aa1
Wesfarmers Limited
A2
A1
A3
Nippon Telegraph and Telephone Corporation
Aa1
Aaa
A1
Singapore Telecommunications Limited
A2
A1
A1
Japan , Government of
Aaa
Aaa
A1
China , Government of
A3
A3
A1
Australia , Government of
Aaa
Aaa
Aaa
CDS Spread Increases
Issuer
Senior Ratings
Mar. 23
Mar. 16
Spread Diff
Halyk Savings Bank of Kazakhstan
Ba2
437
402
35
Macquarie Group Limited
A3
79
71
7
Chorus Limited
Baa2
81
74
7
Westpac Banking Corporation
Aa3
52
46
6
National Australia Bank Limited
Aa3
47
41
6
East Japan Railway Company
A1
31
25
6
Woolworths Group Limited
Baa2
68
62
6
Commonwealth Bank of Australia
Aa3
45
40
5
Macquarie Bank Limited
A2
52
47
5
Telstra Corporation Limited
A2
55
50
5
CDS Spread Decreases
Issuer
Senior Ratings
Mar. 23
Mar. 16
Spread Diff
Development Bank of Kazakhstan
Baa2
298
362
-64
SoftBank Group Corp.
Ba3
372
423
-50
Kazakhstan , Government of
Baa2
167
201
-34
Nissan Motor Co., Ltd.
Baa3
141
161
-20
Nippon Yusen Kabushiki Kaisha
Ba3
47
63
-16
Mitsui O.S.K. Lines, Ltd.
B1
64
80
-15
Industrial & Commercial Bank of China Ltd
A1
66
80
-14
Bank of China Limited
A1
66
78
-13
Bank of East Asia, Limited
A3
70
81
-12
China Development Bank
A1
68
78
-9
Source: Moody's, CMA
Figure 5. CDS Movers - APAC ( March 16, 2022 – March 23, 2022)
CDS Implied Ratings
CDS Implied Ratings
CDS Spreads
CDS Spreads
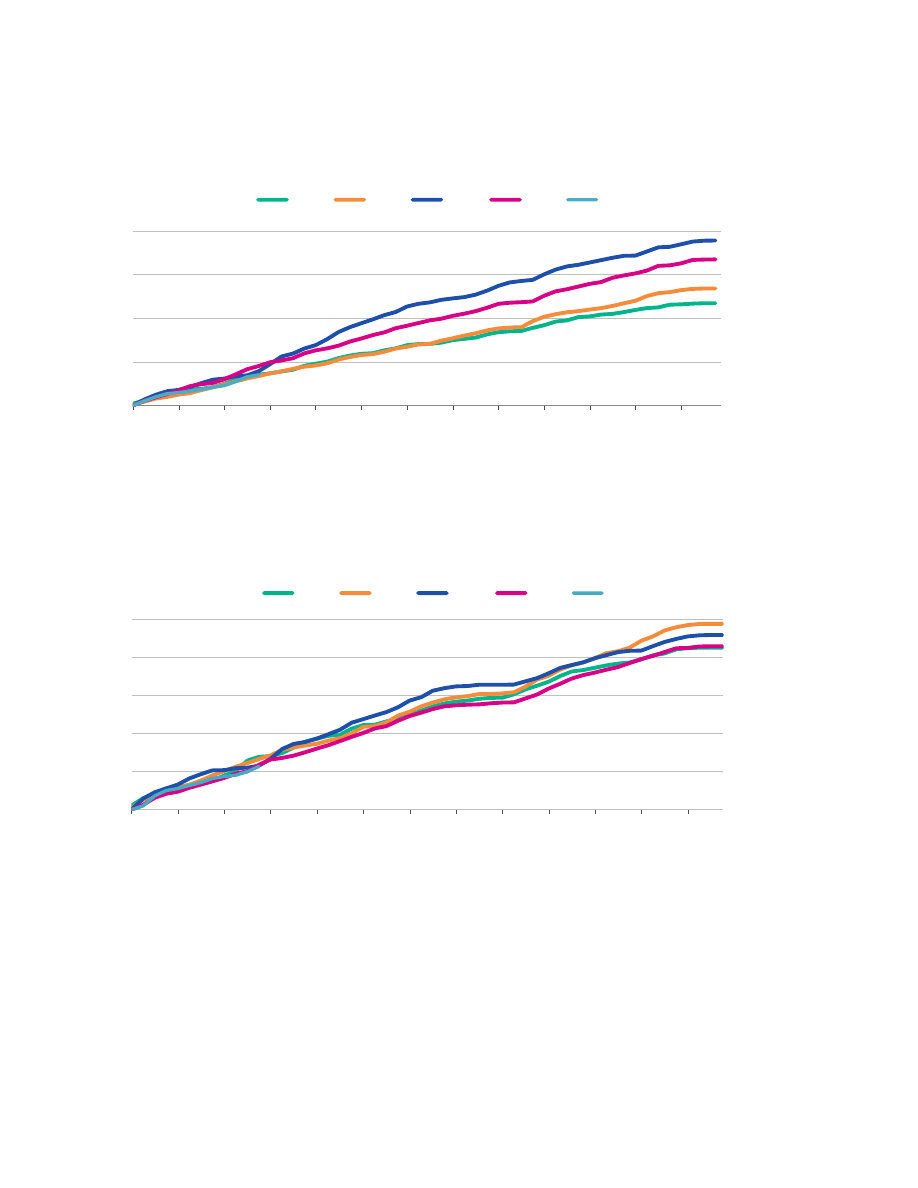
MOODY’S ANALYTICS CAPITAL MARKETS RESEARCH / WEEKLY MARKET OUTLOOK
22
ISSUANCE
0
700
1,400
2,100
2,800
0
700
1,400
2,100
2,800
Jan Feb Mar
Apr
May
Jun
Jul
Aug
Sep
Oct
Nov
Dec
Issuance ($B)
Issuance ($B)
2018
2019
2020
2021
2022
Source:
Moody's / Dealogic
Figure 6. Market Cumulative Issuance - Corporate & Financial Institutions: USD Denominated
0
200
400
600
800
1,000
0
200
400
600
800
1,000
Jan Feb Mar
Apr
May
Jun
Jul
Aug
Sep
Oct
Nov
Dec
Issuance ($B)
Issuance ($B)
2018
2019
2020
2021
2022
Source:
Moody's / Dealogic
Figure 7. Market Cumulative Issuance - Corporate & Financial Institutions: Euro Denominated

MOODY’S ANALYTICS CAPITAL MARKETS RESEARCH / WEEKLY MARKET OUTLOOK
23
ISSUANCE
Investment-Grade
High-Yield
Total*
Amount
Amount
Amount
$B
$B
$B
Weekly
31.280
1.000
33.507
Year-to-Date
427.545
52.496
494.796
Investment-Grade
High-Yield
Total*
Amount
Amount
Amount
$B
$B
$B
Weekly
21.572
2.472
26.792
Year-to-Date
207.595
15.423
227.031
* Difference represents issuance with pending ratings.
Source: Moody's/ Dealogic
USD Denominated
Euro Denominated
Figure 8. Issuance: Corporate & Financial Institutions

MOODY’S ANALYTICS CAPITAL MARKETS RESEARCH / WEEKLY MARKET OUTLOOK
24
To order reprints of this report (100 copies minimum), please call 212.553.1658 .
Report Number: 1323358
Contact Us
Editor
Reid Kanaley
Americas
+1.212.553.1658
Europe
+44.20.7772.5454
clientservices.emea@moodys.com
Asia (Excluding Japan )
+85 2 2916 1121
clientservices.asia@moodys.com
Japan
+81 3 5408 4100
clientservices.japan@moodys.com

MOODY’S ANALYTICS CAPITAL MARKETS RESEARCH / WEEKLY MARKET OUTLOOK
25
© 2022 Moody’s Corporation, Moody’s Investors Service, Inc. , Moody’s Analytics, Inc. and/or their licensors and affiliates (collectively, “MOODY’S”). All rights reserved.
CREDIT RATINGS ISSUED BY MOODY'S CREDIT RATINGS AFFILIATES ARE THEIR CURRENT OPINIONS OF THE RELATIVE FUTURE CREDIT RISK OF ENTITIES,
CREDIT COMMITMENTS, OR DEBT OR DEBT-LIKE SECURITIES, AND MATERIALS, PRODUCTS, SERVICES AND INFORMATION PUBLISHED BY MOODY’S
(COLLECTIVELY, “PUBLICATIONS”) MAY INCLUDE SUCH CURRENT OPINIONS. MOODY’S DEFINES CREDIT RISK AS THE RISK THAT AN ENTITY MAY NOT
MEET ITS CONTRACTUAL FINANCIAL OBLIGATIONS AS THEY COME DUE AND ANY ESTIMATED FINANCIAL LOSS IN THE EVENT OF DEFAULT OR
IMPAIRMENT. SEE APPLICABLE MOODY’S RATING SYMBOLS AND DEFINITIONS PUBLICATION FOR INFORMATION ON THE TYPES OF CONTRACTUAL
FINANCIAL OBLIGATIONS ADDRESSED BY MOODY’S CREDIT RATINGS. CREDIT RATINGS DO NOT ADDRESS ANY OTHER RISK, INCLUDING BUT NOT
LIMITED TO: LIQUIDITY RISK, MARKET VALUE RISK, OR PRICE VOLATILITY. CREDIT RATINGS, NON-CREDIT ASSESSMENTS (“ASSESSMENTS”), AND OTHER
OPINIONS INCLUDED IN MOODY’S PUBLICATIONS ARE NOT STATEMENTS OF CURRENT OR HISTORICAL FACT. MOODY’S PUBLICATIONS MAY ALSO
INCLUDE QUANTITATIVE MODEL-BASED ESTIMATES OF CREDIT RISK AND RELATED OPINIONS OR COMMENTARY PUBLISHED BY MOODY’S ANALYTICS,
INC. AND/OR ITS AFFILIATES. MOODY’S CREDIT RATINGS, ASSESSMENTS, OTHER OPINIONS AND PUBLICATIONS DO NOT CONSTITUTE OR PROVIDE
INVESTMENT OR FINANCIAL ADVICE, AND MOODY’S CREDIT RATINGS, ASSESSMENTS, OTHER OPINIONS AND PUBLICATIONS ARE NOT AND DO NOT
PROVIDE RECOMMENDATIONS TO PURCHASE, SELL, OR HOLD PARTICULAR SECURITIES. MOODY’S CREDIT RATINGS, ASSESSMENTS, OTHER OPINIONS
AND PUBLICATIONS DO NOT COMMENT ON THE SUITABILITY OF AN INVESTMENT FOR ANY PARTICULAR INVESTOR. MOODY’S ISSUES ITS CREDIT
RATINGS, ASSESSMENTS AND OTHER OPINIONS AND PUBLISHES ITS PUBLICATIONS WITH THE EXPECTATION AND UNDERSTANDING THAT EACH
INVESTOR WILL, WITH DUE CARE , MAKE ITS OWN STUDY AND EVALUATION OF EACH SECURITY THAT IS UNDER CONSIDERATION FOR PURCHASE,
HOLDING, OR SALE.
MOODY’S CREDIT RATINGS, ASSESSMENTS, OTHER OPINIONS, AND PUBLICATIONS ARE NOT INTENDED FOR USE BY RETAIL INVESTORS AND IT WOULD BE RECKLESS
AND INAPPROPRIATE FOR RETAIL INVESTORS TO USE MOODY’S CREDIT RATINGS, ASSESSMENTS, OTHER OPINIONS OR PUBLICATIONS WHEN MAKING AN
INVESTMENT DECISION. IF IN DOUBT YOU SHOULD CONTACT YOUR FINANCIAL OR OTHER PROFESSIONAL ADVISER.
ALL INFORMATION CONTAINED HEREIN IS PROTECTED BY LAW, INCLUDING BUT NOT LIMITED TO, COPYRIGHT LAW, AND NONE OF SUCH INFORMATION MAY BE
COPIED OR OTHERWISE REPRODUCED, REPACKAGED, FURTHER TRANSMITTED, TRANSFERRED, DISSEMINATED, REDISTRIBUTED OR RESOLD, OR STORED FOR
SUBSEQUENT USE FOR ANY SUCH PURPOSE, IN WHOLE OR IN PART, IN ANY FORM OR MANNER OR BY ANY MEANS WHATSOEVER, BY ANY PERSON WITHOUT
MOODY’S PRIOR WRITTEN CONSENT.
MOODY’S CREDIT RATINGS, ASSESSMENTS, OTHER OPINIONS AND PUBLICATIONS ARE NOT INTENDED FOR USE BY ANY PERSON AS A BENCHMARK AS THAT TERM IS
DEFINED FOR REGULATORY PURPOSES AND MUST NOT BE USED IN ANY WAY THAT COULD RESULT IN THEM BEING CONSIDERED A BENCHMARK.
All information contained herein is obtained by MOODY’S from sources believed by it to be accurate and reliable. Because of the possibility of human or mechanical error as
well as other factors, however, all information contained herein is provided “AS IS” without warranty of any kind. MOODY'S adopts all necessary measures so that the
information it uses in assigning a credit rating is of sufficient quality and from sources MOODY'S considers to be reliable including, when appropriate, independent third-party
sources. However, MOODY’S is not an auditor and cannot in every instance independently verify or validate information received in the rating process or in preparing its
Publications.
To the extent permitted by law, MOODY’S and its directors, officers, employees, agents, representatives, licensors and suppliers disclaim liability to any person or entity for
any indirect, special, consequential, or incidental losses or damages whatsoever arising from or in connection with the information contained herein or the use of or inability to
use any such information, even if MOODY’S or any of its directors, officers, employees, agents, representatives, licensors or suppliers is advised in advance of the possibility of
such losses or damages, including but not limited to: (a) any loss of present or prospective profits or (b) any loss or damage arising where the relevant financial instrument is
not the subject of a particular credit rating assigned by MOODY’S.
To the extent permitted by law, MOODY’S and its directors, officers, employees, agents, representatives, licensors and suppliers disclaim liability for any direct or
compensatory losses or damages caused to any person or entity, including but not limited to by any negligence (but excluding fraud, willful misconduct or any other type of
liability that, for the avoidance of doubt, by law cannot be excluded) on the part of, or any contingency within or beyond the control of, MOODY’S or any of its directors,
officers, employees, agents, representatives, licensors or suppliers, arising from or in connection with the information contained herein or the use of or inability to use any such
information.
NO WARRANTY, EXPRESS OR IMPLIED, AS TO THE ACCURACY, TIMELINESS, COMPLETENESS, MERCHANTABILITY OR FITNESS FOR ANY PARTICULAR PURPOSE OF ANY
CREDIT RATING, ASSESSMENT, OTHER OPINION OR INFORMATION IS GIVEN OR MADE BY MOODY’S IN ANY FORM OR MANNER WHATSOEVER.
Moody’s Investors Service, Inc. , a wholly-owned credit rating agency subsidiary of Moody’s Corporation (“MCO”), hereby discloses that most issuers of debt securities
(including corporate and municipal bonds, debentures, notes and commercial paper) and preferred stock rated by Moody’s Investors Service, Inc. have, prior to assignment of
any credit rating, agreed to pay to Moody’s Investors Service, Inc. for credit ratings opinions and services rendered by it fees ranging from $1,000 to approximately $5,000,000 .
MCO and Moody’s Investors Service also maintain policies and procedures to address the independence of Moody’s Investors Service credit ratings and credit rating processes.
Information regarding certain affiliations that may exist between directors of MCO and rated entities, and between entities who hold credit ratings from Moody’s Investors
Service and have also publicly reported to the SEC an ownership interest in MCO of more than 5%, is posted annually at
under the heading “Investor
Relations — Corporate Governance — Director and Shareholder Affiliation Policy.”
Additional terms for Australia only: Any publication into Australia of this document is pursuant to the Australian Financial Services License of MOODY’S affiliate, Moody’s
Investors Service Pty Limited ABN 61 003 399 657AFSL 336969 and/or Moody’s Analytics Australia Pty Ltd ABN 94 105 136 972 AFSL 383569 (as applicable). This document
is intended to be provided only to “wholesale clients” within the meaning of section 761G of the Corporations Act 2001. By continuing to access this document from within
Australia , you represent to MOODY’S that you are, or are accessing the document as a representative of, a “wholesale client” and that neither you nor the entity you represent
will directly or indirectly disseminate this document or its contents to “retail clients” within the meaning of section 761G of the Corporations Act 2001. MOODY’S credit rating
is an opinion as to the creditworthiness of a debt obligation of the issuer, not on the equity securities of the issuer or any form of security that is available to retail investors.
Additional terms for Japan only: Moody's Japan K.K. (“MJKK”) is a wholly owned credit rating agency subsidiary of Moody's Group Japan G.K., which is wholly owned by
Moody’s Overseas Holdings Inc., a wholly owned subsidiary of MCO. Moody’s SF Japan K.K. (“MSFJ”) is a wholly owned credit rating agency subsidiary of MJKK. MSFJ is not a
Nationally Recognized Statistical Rating Organization (“NRSRO”). Therefore, credit ratings assigned by MSFJ are Non-NRSRO Credit Ratings. Non-NRSRO Credit Ratings are
assigned by an entity that is not a NRSRO and, consequently, the rated obligation will not qualify for certain types of treatment under U.S. laws. MJKK and MSFJ are credit
rating agencies registered with the Japan Financial Services Agency and their registration numbers are FSA Commissioner (Ratings) No. 2 and 3 respectively.
MJKK or MSFJ (as applicable) hereby disclose that most issuers of debt securities (including corporate and municipal bonds, debentures, notes and commercial paper) and
preferred stock rated by MJKK or MSFJ (as applicable) have, prior to assignment of any credit rating, agreed to pay to MJKK or MSFJ (as applicable) for credit ratings opinions
and services rendered by it fees ranging from JPY100,000 to approximately JPY550,000,000 .
MJKK and MSFJ also maintain policies and procedures to address Japanese regulatory requirements.
