
 Yahoo Finance
 How Financially Strong Is Excelpoint Technology Ltd (SGX:BDF)?

Investors are always looking for growth in small-cap stocks like Excelpoint Technology Ltd (SGX:BDF), with a market cap of S$71.15m. However, an important fact which most ignore is: how financially healthy is the business? Electronic companies, even ones that are profitable, are more likely to be higher risk. Evaluating financial health as part of your investment thesis is vital. Here are few basic financial health checks you should consider before taking the plunge. However, this commentary is still very high-level, so I suggest you dig deeper yourself into BDF here.
Does BDF produce enough cash relative to debt?
Over the past year, BDF has ramped up its debt from S$123.50m to S$142.72m . With this increase in debt, BDF currently has S$12.12m remaining in cash and short-term investments , ready to deploy into the business. Moving onto cash from operations, its operating cash flow is not yet significant enough to calculate a meaningful cash-to-debt ratio, indicating that operational efficiency is something we’d need to take a look at. For this article’s sake, I won’t be looking at this today, but you can examine some of BDF’s operating efficiency ratios such as ROA here.
Does BDF’s liquid assets cover its short-term commitments?
Looking at BDF’s most recent S$316.00m liabilities, it seems that the business has maintained a safe level of current assets to meet its obligations, with the current ratio last standing at 1.22x. Usually, for Electronic companies, this is a suitable ratio as there’s enough of a cash buffer without holding too capital in low return investments.
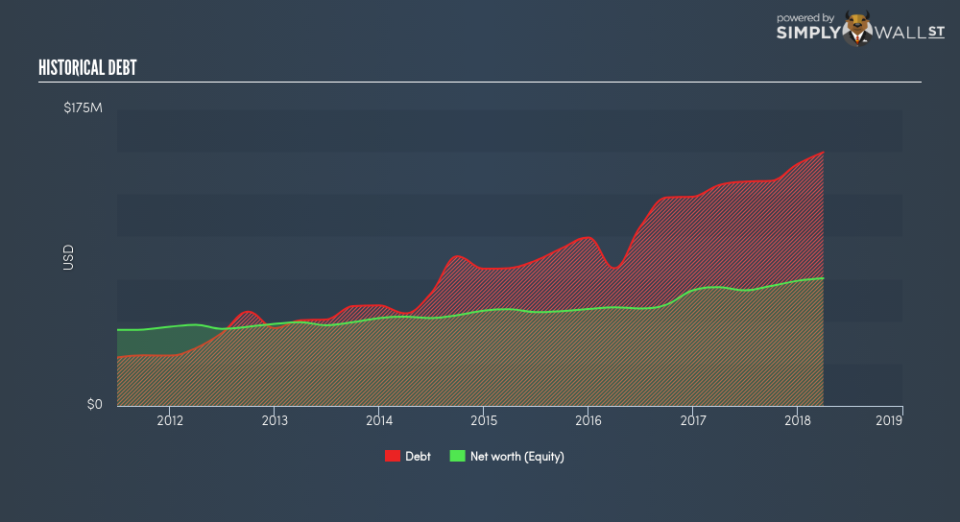
Is BDF’s debt level acceptable?
Since total debt levels have outpaced equities, BDF is a highly leveraged company. This is not uncommon for a small-cap company given that debt tends to be lower-cost and at times, more accessible. We can test if BDF’s debt levels are sustainable by measuring interest payments against earnings of a company. Ideally, earnings before interest and tax (EBIT) should cover net interest by at least three times. For BDF, the ratio of 3.17x suggests that interest is appropriately covered, which means that debtors may be willing to loan the company more money, giving BDF ample headroom to grow its debt facilities.
Next Steps:
BDF’s debt and cash flow levels indicate room for improvement. Its cash flow coverage of less than a quarter of debt means that operating efficiency could be an issue. However, the company exhibits an ability to meet its near term obligations should an adverse event occur. I admit this is a fairly basic analysis for BDF’s financial health. Other important fundamentals need to be considered alongside. I recommend you continue to research Excelpoint Technology to get a more holistic view of the stock by looking at:
Future Outlook: What are well-informed industry analysts predicting for BDF’s future growth? Take a look at our free research report of analyst consensus for BDF’s outlook.
Historical Performance: What has BDF’s returns been like over the past? Go into more detail in the past track record analysis and take a look at the free visual representations of our analysis for more clarity.
Other High-Performing Stocks: Are there other stocks that provide better prospects with proven track records? Explore our free list of these great stocks here.
To help readers see pass the short term volatility of the financial market, we aim to bring you a long-term focused research analysis purely driven by fundamental data. Note that our analysis does not factor in the latest price sensitive company announcements.
The author is an independent contributor and at the time of publication had no position in the stocks mentioned.
