
 Yahoo Finance
 Federal International (2000) (SGX:BDU) Might Have The Makings Of A Multi-Bagger
What are the early trends we should look for to identify a stock that could multiply in value over the long term? Amongst other things, we'll want to see two things; firstly, a growing return on capital employed (ROCE) and secondly, an expansion in the company's amount of capital employed. If you see this, it typically means it's a company with a great business model and plenty of profitable reinvestment opportunities. So when we looked at Federal International (2000) (SGX:BDU) and its trend of ROCE, we really liked what we saw.
Return On Capital Employed (ROCE): What Is It?
For those that aren't sure what ROCE is, it measures the amount of pre-tax profits a company can generate from the capital employed in its business. The formula for this calculation on Federal International (2000) is:
Return on Capital Employed = Earnings Before Interest and Tax (EBIT) ÷ (Total Assets - Current Liabilities)
0.0026 = S$179k ÷ (S$94m - S$26m) (Based on the trailing twelve months to December 2023).
Therefore, Federal International (2000) has an ROCE of 0.3%. In absolute terms, that's a low return and it also under-performs the Trade Distributors industry average of 9.8%.
View our latest analysis for Federal International (2000)
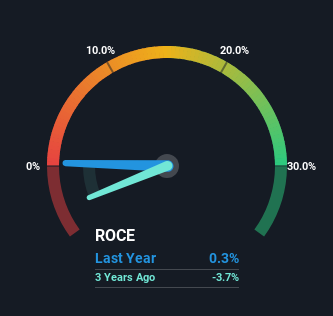
Historical performance is a great place to start when researching a stock so above you can see the gauge for Federal International (2000)'s ROCE against it's prior returns. If you're interested in investigating Federal International (2000)'s past further, check out this free graph covering Federal International (2000)'s past earnings, revenue and cash flow.
The Trend Of ROCE
Shareholders will be relieved that Federal International (2000) has broken into profitability. The company was generating losses five years ago, but has managed to turn it around and as we saw earlier is now earning 0.3%, which is always encouraging. On top of that, what's interesting is that the amount of capital being employed has remained steady, so the business hasn't needed to put any additional money to work to generate these higher returns. So while we're happy that the business is more efficient, just keep in mind that could mean that going forward the business is lacking areas to invest internally for growth. Because in the end, a business can only get so efficient.
What We Can Learn From Federal International (2000)'s ROCE
In summary, we're delighted to see that Federal International (2000) has been able to increase efficiencies and earn higher rates of return on the same amount of capital. And since the stock has fallen 26% over the last five years, there might be an opportunity here. So researching this company further and determining whether or not these trends will continue seems justified.
One final note, you should learn about the 2 warning signs we've spotted with Federal International (2000) (including 1 which is a bit unpleasant) .
If you want to search for solid companies with great earnings, check out this free list of companies with good balance sheets and impressive returns on equity.
Have feedback on this article? Concerned about the content? Get in touch with us directly. Alternatively, email editorial-team (at) simplywallst.com.
This article by Simply Wall St is general in nature. We provide commentary based on historical data and analyst forecasts only using an unbiased methodology and our articles are not intended to be financial advice. It does not constitute a recommendation to buy or sell any stock, and does not take account of your objectives, or your financial situation. We aim to bring you long-term focused analysis driven by fundamental data. Note that our analysis may not factor in the latest price-sensitive company announcements or qualitative material. Simply Wall St has no position in any stocks mentioned.
