
 Yahoo Finance
 Should You Expect Keong Hong Holdings Limited (SGX:5TT) To Continue Delivering An ROE Of 32.07%?

This analysis is intended to introduce important early concepts to people who are starting to invest and want to better understand how you can grow your money by investing in Keong Hong Holdings Limited (SGX:5TT).
Keong Hong Holdings Limited (SGX:5TT) outperformed the Construction and Engineering industry on the basis of its ROE – producing a higher 32.07% relative to the peer average of 8.47% over the past 12 months. Superficially, this looks great since we know that 5TT has generated big profits with little equity capital; however, ROE doesn’t tell us how much 5TT has borrowed in debt. In this article, we’ll closely examine some factors like financial leverage to evaluate the sustainability of 5TT’s ROE. See our latest analysis for Keong Hong Holdings
Breaking down Return on Equity
Return on Equity (ROE) weighs Keong Hong Holdings’s profit against the level of its shareholders’ equity. An ROE of 32.07% implies SGD0.32 returned on every SGD1 invested. Generally speaking, a higher ROE is preferred; however, there are other factors we must also consider before making any conclusions.
Return on Equity = Net Profit ÷ Shareholders Equity
ROE is measured against cost of equity in order to determine the efficiency of Keong Hong Holdings’s equity capital deployed. Its cost of equity is 9.89%. Given a positive discrepancy of 22.18% between return and cost, this indicates that Keong Hong Holdings pays less for its capital than what it generates in return, which is a sign of capital efficiency. ROE can be broken down into three different ratios: net profit margin, asset turnover, and financial leverage. This is called the Dupont Formula:
Dupont Formula
ROE = profit margin × asset turnover × financial leverage
ROE = (annual net profit ÷ sales) × (sales ÷ assets) × (assets ÷ shareholders’ equity)
ROE = annual net profit ÷ shareholders’ equity
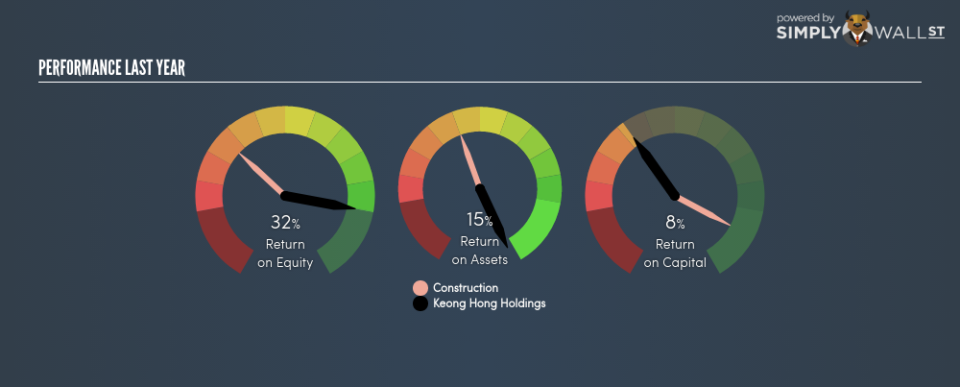
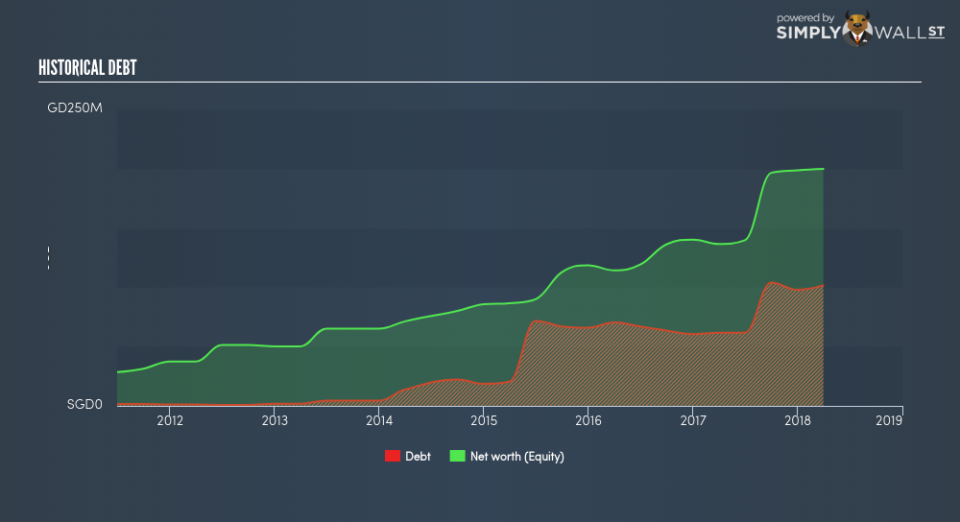
Basically, profit margin measures how much of revenue trickles down into earnings which illustrates how efficient the business is with its cost management. The other component, asset turnover, illustrates how much revenue Keong Hong Holdings can make from its asset base. Finally, financial leverage will be our main focus today. It shows how much of assets are funded by equity and can show how sustainable the company’s capital structure is. Since ROE can be inflated by excessive debt, we need to examine Keong Hong Holdings’s debt-to-equity level. The debt-to-equity ratio currently stands at a sensible 50.89%, meaning the above-average ROE is due to its capacity to produce profit growth without a huge debt burden.
Next Steps:
While ROE is a relatively simple calculation, it can be broken down into different ratios, each telling a different story about the strengths and weaknesses of a company. Keong Hong Holdings’s ROE is impressive relative to the industry average and also covers its cost of equity. Its high ROE is not likely to be driven by high debt. Therefore, investors may have more confidence in the sustainability of this level of returns going forward. Although ROE can be a useful metric, it is only a small part of diligent research.
For Keong Hong Holdings, I’ve compiled three key factors you should look at:
Financial Health: Does it have a healthy balance sheet? Take a look at our free balance sheet analysis with six simple checks on key factors like leverage and risk.
Future Earnings: How does Keong Hong Holdings’s growth rate compare to its peers and the wider market? Dig deeper into the analyst consensus number for the upcoming years by interacting with our free analyst growth expectation chart.
Other High-Growth Alternatives : Are there other high-growth stocks you could be holding instead of Keong Hong Holdings? Explore our interactive list of stocks with large growth potential to get an idea of what else is out there you may be missing!
To help readers see pass the short term volatility of the financial market, we aim to bring you a long-term focused research analysis purely driven by fundamental data. Note that our analysis does not factor in the latest price sensitive company announcements.
The author is an independent contributor and at the time of publication had no position in the stocks mentioned.
