
 Yahoo Finance
 Everbridge Inc (EVBG) Q1 2024 Earnings: Revenue Slightly Misses Analyst Expectations Amidst ...
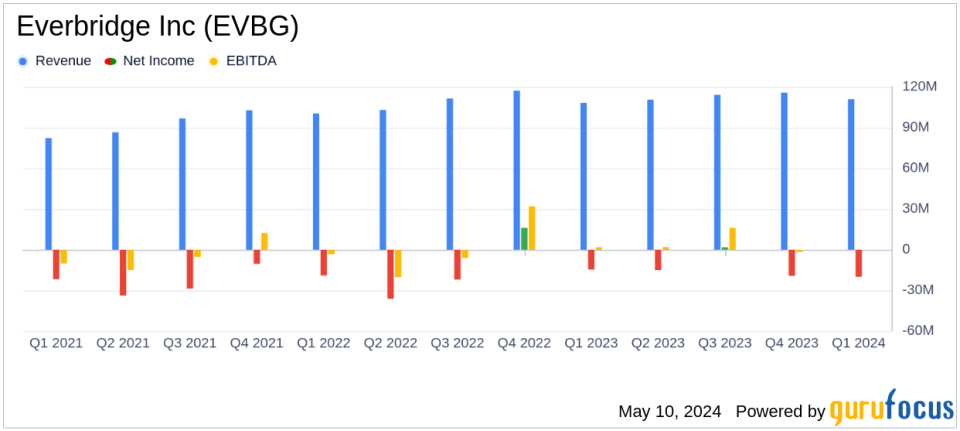
Revenue: Reported at $111.4 million, up 3% year-over-year, slightly below the estimate of $112.1 million.
Net Loss: GAAP net loss widened to $(20.1) million from $(14.6) million year-over-year.
Non-GAAP Net Income: Totaled $8.0 million, down from $10.8 million in the previous year, with non-GAAP EPS at $0.18, below the estimated $0.39 EPS.
Subscription Services Revenue: Increased by 7% to $105.3 million, indicating strong recurring revenue streams.
Adjusted EBITDA: Declined to $13.7 million from $15.9 million year-over-year, reflecting tighter operational control.
Annualized Recurring Revenue (ARR): Reached $416 million, demonstrating robust customer retention and acquisition with 26 new CEM customers added.
Cash Flow: Operating cash flow significantly reduced to $2.1 million from $20.6 million in the prior year, highlighting challenges in cash generation.
On May 9, 2024, Everbridge Inc (NASDAQ:EVBG), a leading provider of critical event management solutions, disclosed its financial results for the first quarter ended March 31, 2024, through its 8-K filing. The company reported a modest year-over-year revenue increase but faced a significant expansion in its net loss, reflecting ongoing operational challenges.
Financial Performance Overview
Everbridge's revenue for the quarter stood at $111.4 million, marking a 3% increase from $108.3 million in the same period last year, yet slightly below the analyst's expectation of $112.10 million. The revenue growth was primarily driven by a 7% increase in subscription services, which totaled $105.3 million. However, this was partially offset by a 36% decline in revenue from professional services, software licenses, and other, which dropped to $6.1 million.
The company's GAAP net loss widened to $(20.1) million from $(14.6) million a year earlier, with a GAAP diluted net loss per share of $(0.49), deteriorating from $(0.36) in the first quarter of 2023. This increase in net loss can be attributed to higher operating expenses and a significant reduction in cash flow from operations, which plummeted from $20.6 million in the previous year to just $2.1 million.
Key Financial Metrics and Non-GAAP Measures
Everbridge also reported non-GAAP figures, which are often used to provide a clearer picture of the company's operational performance by excluding certain one-time costs and non-cash expenses. Non-GAAP operating income was $8.2 million, down from $10.1 million in the prior year. Non-GAAP net income amounted to $8.0 million, resulting in a non-GAAP diluted net income per share of $0.18, both decreasing from the previous year's results.
Adjusted EBITDA was reported at $13.7 million, a decline from $15.9 million year-over-year. The company's Annualized Recurring Revenue (ARR) reached $416 million, with 26 critical event management (CEM) customers added during the quarter.
Balance Sheet and Cash Flow Insights
Everbridge's balance sheet shows a total of $988.463 million in assets as of March 31, 2024. The company held $121.432 million in cash and cash equivalents, a slight decrease from $122.440 million at the end of 2023. Total liabilities stood at $700.307 million, with stockholders' equity at $288.156 million.
The cash flow statements reveal challenges in liquidity, with net cash provided by operating activities significantly reduced. This reduction in cash flow could impact the company's ability to fund operations and invest in growth initiatives without external financing.
Operational Challenges and Market Position
Despite the financial setbacks, Everbridge continues to maintain its position as a leader in the critical event management space. The company's ability to add new CEM customers and manage substantial deals over $100,000 indicates ongoing market demand for its offerings. However, the widening net loss and reduced cash flow highlight the need for careful financial and operational management moving forward.
Everbridge's focus on non-GAAP measures and adjusted metrics suggests an emphasis on portraying a managed financial outlook, though these figures also underscore the challenges in maintaining profitability and cost control.
Conclusion
Everbridge Inc faces a pivotal period as it strives to balance growth and profitability. The company's ability to innovate and adapt to market needs will likely be key factors in overcoming current financial challenges and achieving long-term success. Investors and stakeholders will be watching closely to see how Everbridge navigates these challenges in subsequent quarters.
Explore the complete 8-K earnings release (here) from Everbridge Inc for further details.
This article first appeared on GuruFocus.
