
 Yahoo Finance
 Estimating The Intrinsic Value Of Spire Inc. (NYSE:SR)
Key Insights
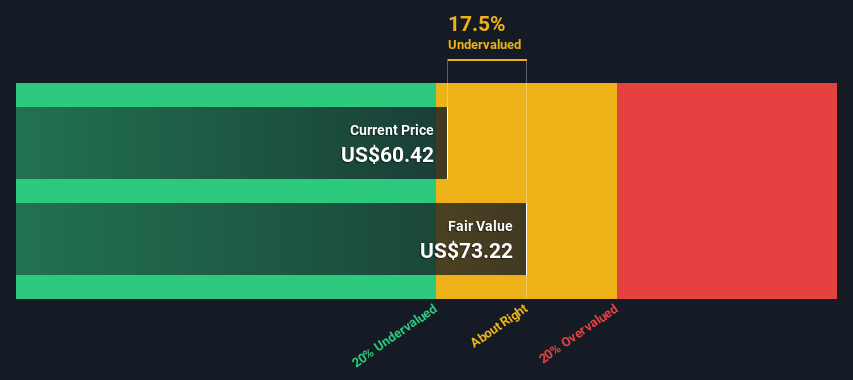
Spire's estimated fair value is US$73.22 based on 2 Stage Free Cash Flow to Equity
With US$60.42 share price, Spire appears to be trading close to its estimated fair value
The US$64.17 analyst price target for SR is 12% less than our estimate of fair value
How far off is Spire Inc. (NYSE:SR) from its intrinsic value? Using the most recent financial data, we'll take a look at whether the stock is fairly priced by projecting its future cash flows and then discounting them to today's value. This will be done using the Discounted Cash Flow (DCF) model. It may sound complicated, but actually it is quite simple!
We would caution that there are many ways of valuing a company and, like the DCF, each technique has advantages and disadvantages in certain scenarios. If you want to learn more about discounted cash flow, the rationale behind this calculation can be read in detail in the Simply Wall St analysis model.
Check out our latest analysis for Spire
The Model
We are going to use a two-stage DCF model, which, as the name states, takes into account two stages of growth. The first stage is generally a higher growth period which levels off heading towards the terminal value, captured in the second 'steady growth' period. To begin with, we have to get estimates of the next ten years of cash flows. Where possible we use analyst estimates, but when these aren't available we extrapolate the previous free cash flow (FCF) from the last estimate or reported value. We assume companies with shrinking free cash flow will slow their rate of shrinkage, and that companies with growing free cash flow will see their growth rate slow, over this period. We do this to reflect that growth tends to slow more in the early years than it does in later years.
A DCF is all about the idea that a dollar in the future is less valuable than a dollar today, so we discount the value of these future cash flows to their estimated value in today's dollars:
10-year free cash flow (FCF) estimate
2024 | 2025 | 2026 | 2027 | 2028 | 2029 | 2030 | 2031 | 2032 | 2033 | |
Levered FCF ($, Millions) | -US$215.0m | US$102.0m | US$139.0m | US$167.5m | US$192.6m | US$214.2m | US$232.4m | US$247.9m | US$261.2m | US$272.7m |
Growth Rate Estimate Source | Analyst x1 | Analyst x1 | Analyst x1 | Est @ 20.47% | Est @ 15.02% | Est @ 11.20% | Est @ 8.53% | Est @ 6.66% | Est @ 5.35% | Est @ 4.43% |
Present Value ($, Millions) Discounted @ 6.8% | -US$201 | US$89.5 | US$114 | US$129 | US$139 | US$145 | US$147 | US$147 | US$145 | US$142 |
("Est" = FCF growth rate estimated by Simply Wall St)
Present Value of 10-year Cash Flow (PVCF) = US$995m
The second stage is also known as Terminal Value, this is the business's cash flow after the first stage. The Gordon Growth formula is used to calculate Terminal Value at a future annual growth rate equal to the 5-year average of the 10-year government bond yield of 2.3%. We discount the terminal cash flows to today's value at a cost of equity of 6.8%.
Terminal Value (TV)= FCF2033 × (1 + g) ÷ (r – g) = US$273m× (1 + 2.3%) ÷ (6.8%– 2.3%) = US$6.2b
Present Value of Terminal Value (PVTV)= TV / (1 + r)10= US$6.2b÷ ( 1 + 6.8%)10= US$3.2b
The total value, or equity value, is then the sum of the present value of the future cash flows, which in this case is US$4.2b. In the final step we divide the equity value by the number of shares outstanding. Compared to the current share price of US$60.4, the company appears about fair value at a 17% discount to where the stock price trades currently. The assumptions in any calculation have a big impact on the valuation, so it is better to view this as a rough estimate, not precise down to the last cent.
Important Assumptions
Now the most important inputs to a discounted cash flow are the discount rate, and of course, the actual cash flows. You don't have to agree with these inputs, I recommend redoing the calculations yourself and playing with them. The DCF also does not consider the possible cyclicality of an industry, or a company's future capital requirements, so it does not give a full picture of a company's potential performance. Given that we are looking at Spire as potential shareholders, the cost of equity is used as the discount rate, rather than the cost of capital (or weighted average cost of capital, WACC) which accounts for debt. In this calculation we've used 6.8%, which is based on a levered beta of 0.974. Beta is a measure of a stock's volatility, compared to the market as a whole. We get our beta from the industry average beta of globally comparable companies, with an imposed limit between 0.8 and 2.0, which is a reasonable range for a stable business.
SWOT Analysis for Spire
Strength
Dividend is in the top 25% of dividend payers in the market.
Weakness
Earnings declined over the past year.
Interest payments on debt are not well covered.
Shareholders have been diluted in the past year.
Opportunity
Annual earnings are forecast to grow for the next 3 years.
Good value based on P/E ratio and estimated fair value.
Threat
Debt is not well covered by operating cash flow.
Paying a dividend but company has no free cash flows.
Annual earnings are forecast to grow slower than the American market.
Looking Ahead:
Although the valuation of a company is important, it is only one of many factors that you need to assess for a company. The DCF model is not a perfect stock valuation tool. Instead the best use for a DCF model is to test certain assumptions and theories to see if they would lead to the company being undervalued or overvalued. For example, changes in the company's cost of equity or the risk free rate can significantly impact the valuation. For Spire, we've put together three essential items you should look at:
Risks: For example, we've discovered 3 warning signs for Spire (1 shouldn't be ignored!) that you should be aware of before investing here.
Future Earnings: How does SR's growth rate compare to its peers and the wider market? Dig deeper into the analyst consensus number for the upcoming years by interacting with our free analyst growth expectation chart.
Other Solid Businesses: Low debt, high returns on equity and good past performance are fundamental to a strong business. Why not explore our interactive list of stocks with solid business fundamentals to see if there are other companies you may not have considered!
PS. Simply Wall St updates its DCF calculation for every American stock every day, so if you want to find the intrinsic value of any other stock just search here.
Have feedback on this article? Concerned about the content? Get in touch with us directly. Alternatively, email editorial-team (at) simplywallst.com.
This article by Simply Wall St is general in nature. We provide commentary based on historical data and analyst forecasts only using an unbiased methodology and our articles are not intended to be financial advice. It does not constitute a recommendation to buy or sell any stock, and does not take account of your objectives, or your financial situation. We aim to bring you long-term focused analysis driven by fundamental data. Note that our analysis may not factor in the latest price-sensitive company announcements or qualitative material. Simply Wall St has no position in any stocks mentioned.
