
 Yahoo Finance
 Estimating The Intrinsic Value Of Rightmove plc (LON:RMV)
Key Insights
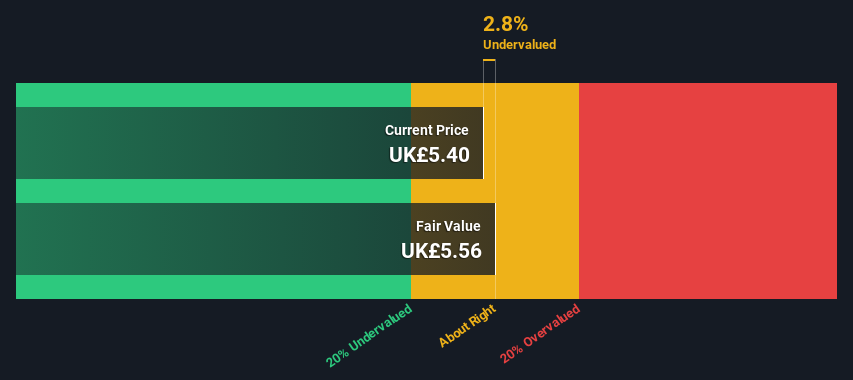
Using the 2 Stage Free Cash Flow to Equity, Rightmove fair value estimate is UK£5.56
Rightmove's UK£5.40 share price indicates it is trading at similar levels as its fair value estimate
Our fair value estimate is 10% lower than Rightmove's analyst price target of UK£6.20
Today we will run through one way of estimating the intrinsic value of Rightmove plc (LON:RMV) by taking the expected future cash flows and discounting them to today's value. One way to achieve this is by employing the Discounted Cash Flow (DCF) model. Models like these may appear beyond the comprehension of a lay person, but they're fairly easy to follow.
We would caution that there are many ways of valuing a company and, like the DCF, each technique has advantages and disadvantages in certain scenarios. If you still have some burning questions about this type of valuation, take a look at the Simply Wall St analysis model.
See our latest analysis for Rightmove
The Method
We use what is known as a 2-stage model, which simply means we have two different periods of growth rates for the company's cash flows. Generally the first stage is higher growth, and the second stage is a lower growth phase. To start off with, we need to estimate the next ten years of cash flows. Where possible we use analyst estimates, but when these aren't available we extrapolate the previous free cash flow (FCF) from the last estimate or reported value. We assume companies with shrinking free cash flow will slow their rate of shrinkage, and that companies with growing free cash flow will see their growth rate slow, over this period. We do this to reflect that growth tends to slow more in the early years than it does in later years.
Generally we assume that a dollar today is more valuable than a dollar in the future, so we need to discount the sum of these future cash flows to arrive at a present value estimate:
10-year free cash flow (FCF) estimate
2024 | 2025 | 2026 | 2027 | 2028 | 2029 | 2030 | 2031 | 2032 | 2033 | |
Levered FCF (£, Millions) | UK£207.3m | UK£225.5m | UK£245.0m | UK£257.2m | UK£267.6m | UK£276.5m | UK£284.5m | UK£291.7m | UK£298.4m | UK£304.8m |
Growth Rate Estimate Source | Analyst x9 | Analyst x9 | Analyst x9 | Est @ 4.99% | Est @ 4.02% | Est @ 3.35% | Est @ 2.87% | Est @ 2.54% | Est @ 2.31% | Est @ 2.15% |
Present Value (£, Millions) Discounted @ 7.5% | UK£193 | UK£195 | UK£197 | UK£193 | UK£187 | UK£179 | UK£172 | UK£164 | UK£156 | UK£148 |
("Est" = FCF growth rate estimated by Simply Wall St)
Present Value of 10-year Cash Flow (PVCF) = UK£1.8b
After calculating the present value of future cash flows in the initial 10-year period, we need to calculate the Terminal Value, which accounts for all future cash flows beyond the first stage. The Gordon Growth formula is used to calculate Terminal Value at a future annual growth rate equal to the 5-year average of the 10-year government bond yield of 1.8%. We discount the terminal cash flows to today's value at a cost of equity of 7.5%.
Terminal Value (TV)= FCF2033 × (1 + g) ÷ (r – g) = UK£305m× (1 + 1.8%) ÷ (7.5%– 1.8%) = UK£5.4b
Present Value of Terminal Value (PVTV)= TV / (1 + r)10= UK£5.4b÷ ( 1 + 7.5%)10= UK£2.6b
The total value is the sum of cash flows for the next ten years plus the discounted terminal value, which results in the Total Equity Value, which in this case is UK£4.4b. In the final step we divide the equity value by the number of shares outstanding. Compared to the current share price of UK£5.4, the company appears about fair value at a 2.8% discount to where the stock price trades currently. Remember though, that this is just an approximate valuation, and like any complex formula - garbage in, garbage out.
The Assumptions
Now the most important inputs to a discounted cash flow are the discount rate, and of course, the actual cash flows. You don't have to agree with these inputs, I recommend redoing the calculations yourself and playing with them. The DCF also does not consider the possible cyclicality of an industry, or a company's future capital requirements, so it does not give a full picture of a company's potential performance. Given that we are looking at Rightmove as potential shareholders, the cost of equity is used as the discount rate, rather than the cost of capital (or weighted average cost of capital, WACC) which accounts for debt. In this calculation we've used 7.5%, which is based on a levered beta of 1.042. Beta is a measure of a stock's volatility, compared to the market as a whole. We get our beta from the industry average beta of globally comparable companies, with an imposed limit between 0.8 and 2.0, which is a reasonable range for a stable business.
SWOT Analysis for Rightmove
Strength
Currently debt free.
Dividends are covered by earnings and cash flows.
Weakness
Earnings growth over the past year underperformed the Interactive Media and Services industry.
Dividend is low compared to the top 25% of dividend payers in the Interactive Media and Services market.
Opportunity
Annual revenue is forecast to grow faster than the British market.
Good value based on P/E ratio and estimated fair value.
Threat
Annual earnings are forecast to grow slower than the British market.
Moving On:
Although the valuation of a company is important, it shouldn't be the only metric you look at when researching a company. The DCF model is not a perfect stock valuation tool. Instead the best use for a DCF model is to test certain assumptions and theories to see if they would lead to the company being undervalued or overvalued. If a company grows at a different rate, or if its cost of equity or risk free rate changes sharply, the output can look very different. For Rightmove, we've put together three important items you should consider:
Financial Health: Does RMV have a healthy balance sheet? Take a look at our free balance sheet analysis with six simple checks on key factors like leverage and risk.
Future Earnings: How does RMV's growth rate compare to its peers and the wider market? Dig deeper into the analyst consensus number for the upcoming years by interacting with our free analyst growth expectation chart.
Other Solid Businesses: Low debt, high returns on equity and good past performance are fundamental to a strong business. Why not explore our interactive list of stocks with solid business fundamentals to see if there are other companies you may not have considered!
PS. The Simply Wall St app conducts a discounted cash flow valuation for every stock on the LSE every day. If you want to find the calculation for other stocks just search here.
Have feedback on this article? Concerned about the content? Get in touch with us directly. Alternatively, email editorial-team (at) simplywallst.com.
This article by Simply Wall St is general in nature. We provide commentary based on historical data and analyst forecasts only using an unbiased methodology and our articles are not intended to be financial advice. It does not constitute a recommendation to buy or sell any stock, and does not take account of your objectives, or your financial situation. We aim to bring you long-term focused analysis driven by fundamental data. Note that our analysis may not factor in the latest price-sensitive company announcements or qualitative material. Simply Wall St has no position in any stocks mentioned.
