
 Yahoo Finance
Ernest Lim: GSS Energy – Bullish Inverse Head And Shoulder Confirmed
In my technical write-up on GSS Energy (GSS) dated 14 September 2017 (click HERE), I highlighted the possibility that GSS may be on the verge of forming a potential inverse head and shoulder formation. For this write-up, I have put in my personal view based on both technical and fundamental aspects.
Read below for more.
Technically Bullish
Why do I feel the chart looks positive?
a) Previously, in my earlier technical write-up, I mentioned that a breach above $0.157 with volume and on a sustained basis points to an eventual measured technical target of around $0.186. GSS has been hovering around in an extremely tight range between $0.159 to 0.164 for the past eight trading sessions. Furthermore, since 31 August 2017, the increase in price is typically accompanied with higher than the 30-day average volume. Therefore, in my opinion, the bullish inverse head and shoulder formation is confirmed and this points to an eventual measured technical target of around $0.186;
b) ADX closed 24.2 amid positively placed DIs. This is indicative of a trend;
c) All the exponential moving averages (EMAs) are rising higher pointing to an uptrend. 20D EMA has formed golden crosses with 50D EMA and 100D EMA. These add more confidence to the strength of the uptrend;
d) Indicators such as OBV and MACD have strengthened.
Near term supports: $0.159 / 0.157 / 0.154
Near term resistances: $0.163 – 0.165 / 0.172 / 0.181 – 0.182
It is noteworthy that a sustained break below $0.155 with volume signifies that the inverse head and shoulder formation may have failed.
Chart 1: Confirmation Of Bullish Inverse Head And Shoulder Formation
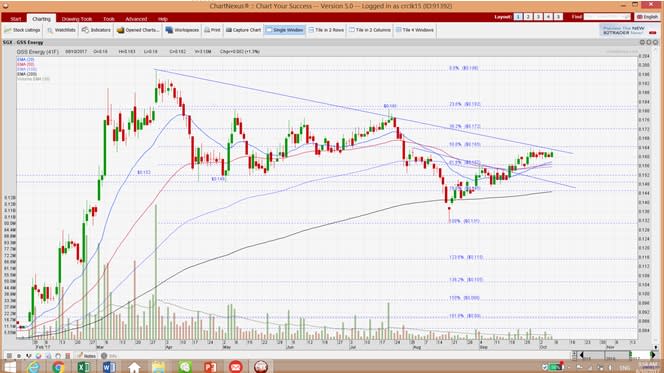
Source: Chartnexus 6 October 2017
Fundamentals Comparison
a) GSS’ share price performance lags behind peers
Since 25 September 2017 (this date was chosen, as most tech stocks hit an intraday low at that time. It also coincided with the intraday low hit by Nasdaq), based on Table 1 below, the technology stocks have moved up an average of 10 percent, led by Valuetronics and Hi-P. By this measure, GSS seems to have lagged in terms of share price performance with a 5 percent gain.
b) Trades at a substantial discount to peers
It is also noteworthy that the sector average for FY17F PE is around 14.5 times. With reference to my write-up dated 18 August 2017 (see HERE), if I work on a general assumption that GSS’ 2H17F constitutes about 60 percent of FY17F PE’s core net profit, GSS is trading at around *8.0 times core annualised FY17F PE. (It is noteworthy that 2HFY16 core PE net profit was around $7.9 million vs 1H16 core PE net profit of around $2.5m). In other words, GSS trades at a substantial discount to its sector. Furthermore, it is noteworthy that GSS is a net cash company with approximately $8.2m cash and negligible borrowings.
*The above is based on a back of the envelope calculation. As I am not an equity analyst, the above is purely my guesstimate and may not be accurate.
Table 1: How GSS fared against other tech stocks since 25 Sep 2017
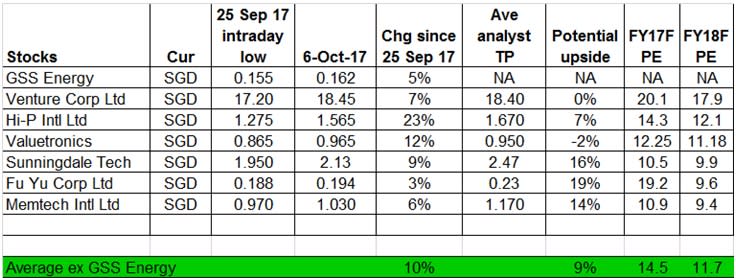
Source: Bloomberg and Ernest’s compilations 6 October 2017
Key Risks
As with (almost all) investments, there are risks involved in investments, especially into small mid cap stocks such as GSS. Such risks have been highlighted before in my earlier write-ups. For GSS, the two events which investors are likely to be watching out for in the near term are:
a) Update on oil production
The largest unknown is whether GSS will hit first oil in the next few months. This is anybody’s guess. However, I guess management is quietly confident as Sydney, GSS’ CEO, has been aggressively accumulating shares from January 2017 to April 2017 with the latest purchase price at $0.175. It is noteworthy if there is no oil, regardless of how undervalued its engineering business is, GSS is likely to face some sort of sell-off.
b) Upcoming 3Q17F results
Investors will know it when GSS announces 3QFY17F results around mid November.
Conclusion
The above is based on my personal observation on GSS’ chart. Readers are advised to refer to GSS’ website HERE and SGX website for more information. There are always risks involved in trading. Please do your research and form your independent opinion.
P.S: I am vested.
Disclaimer
Please refer to the disclaimer HERE
