Engie SA's Dividend Analysis
Exploring the Sustainability and Growth of Engie SA's Dividends
Engie SA (ENGIY) recently announced a dividend of $1.55 per share, payable on an unspecified future date, with the ex-dividend date set for 2024-05-02. As investors anticipate this forthcoming payment, it's crucial to delve into the company's dividend history, yield, and growth rates. Utilizing data from GuruFocus, this article will examine Engie SA's dividend performance and evaluate its sustainability.
What Does Engie SA Do?
This Powerful Chart Made Peter Lynch 29% A Year For 13 Years
How to calculate the intrinsic value of a stock?
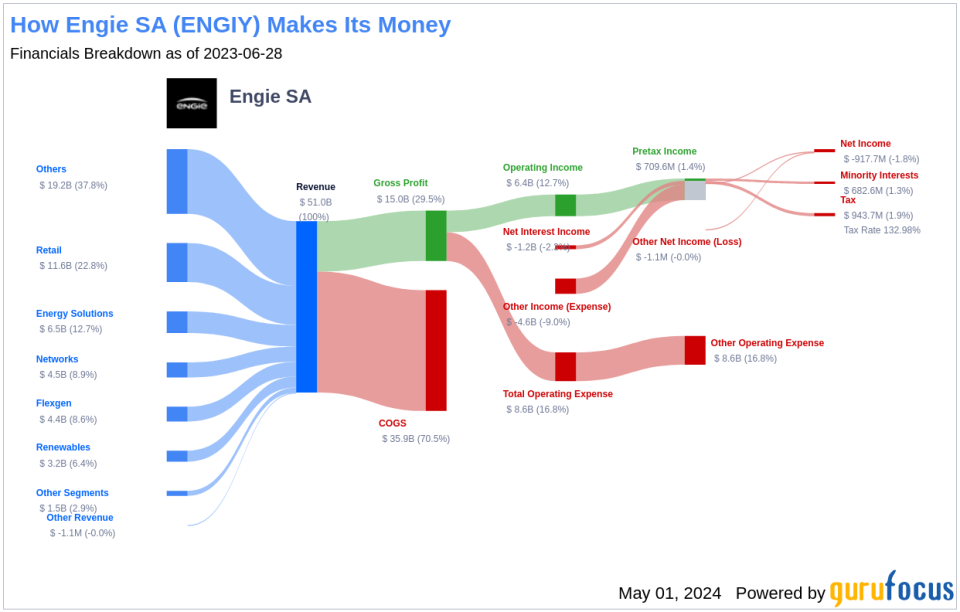
Engie is a global energy powerhouse established through the 2008 merger of Gaz de France and Suez, and later, the acquisition of International Power in 2012. Renamed from GDF Suez to Engie in 2015, the company boasts Europe's largest gas pipeline network in France and operates a global fleet of both conventional and renewable power plants, boasting a consolidated capacity of 64 gigawatts. Engie also manages a diverse array of other energy-related businesses.
A Glimpse at Engie SA's Dividend History
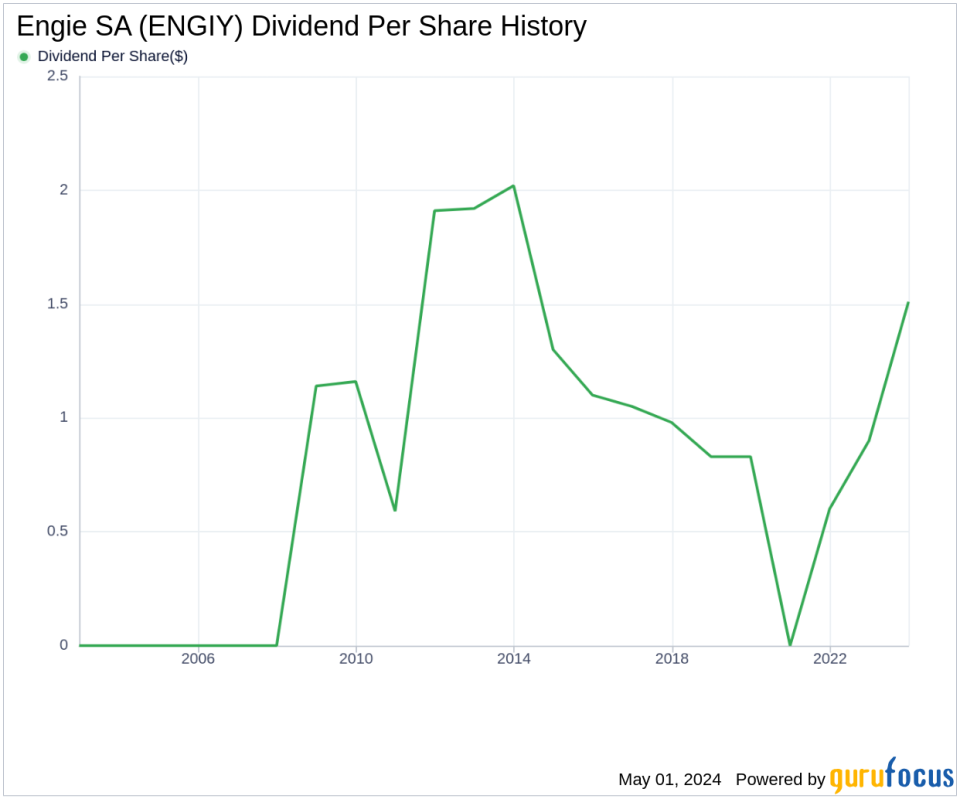
Engie SA has demonstrated a consistent dividend payment record since 2021, distributing dividends annually. Below is a chart depicting the annual Dividends Per Share to help track historical trends.
Breaking Down Engie SA's Dividend Yield and Growth
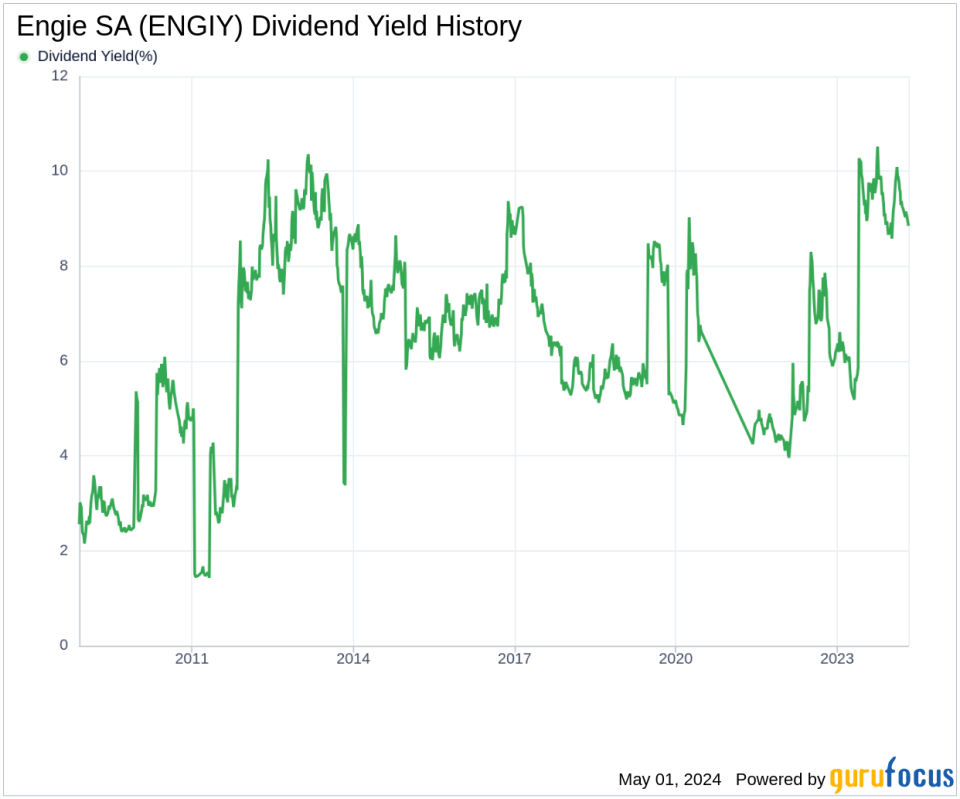
Currently, Engie SA boasts a 12-month trailing dividend yield of 8.84% and a 12-month forward dividend yield of 8.86%, indicating an expected increase in dividend payments over the next year. Additionally, Engie SA's 5-year yield on cost is approximately 8.84%.
The Sustainability Question: Payout Ratio and Profitability
To gauge the sustainability of its dividends, Engie SA's dividend payout ratio is a critical metric. As of December 31, 2023, the ratio stands at 0.44, suggesting that the company retains a substantial portion of its earnings for future growth and to buffer against potential downturns. Engie SA's profitability rank is 6 out of 10, reflecting fair profitability, with net profit reported in 7 of the past 10 years.
Growth Metrics: The Future Outlook
For dividends to be sustainable, robust growth metrics are essential. Engie SA's growth rank of 6 out of 10 indicates a fair growth outlook. The company's revenue per share and 3-year revenue growth rate of approximately 23.00% per year significantly outperform about 84.85% of global competitors, demonstrating a strong revenue model.
Concluding Thoughts on Engie SA's Dividend Strategy
Engie SA's commitment to maintaining a robust dividend payout, coupled with its fair profitability and promising growth metrics, positions it well for future financial stability. Investors considering Engie SA for its dividend prospects might find it a compelling choice, given its consistent dividend history and potential for sustained growth. For those looking to explore further, GuruFocus Premium offers tools like the High Dividend Yield Screener to discover high-yield investment opportunities.
This article, generated by GuruFocus, is designed to provide general insights and is not tailored financial advice. Our commentary is rooted in historical data and analyst projections, utilizing an impartial methodology, and is not intended to serve as specific investment guidance. It does not formulate a recommendation to purchase or divest any stock and does not consider individual investment objectives or financial circumstances. Our objective is to deliver long-term, fundamental data-driven analysis. Be aware that our analysis might not incorporate the most recent, price-sensitive company announcements or qualitative information. GuruFocus holds no position in the stocks mentioned herein.
This article first appeared on GuruFocus.

 Yahoo Finance


