
 Yahoo Finance
 eBay (NASDAQ:EBAY) shareholders have earned a 7.8% CAGR over the last five years
The main point of investing for the long term is to make money. Furthermore, you'd generally like to see the share price rise faster than the market. But eBay Inc. (NASDAQ:EBAY) has fallen short of that second goal, with a share price rise of 34% over five years, which is below the market return. Over the last twelve months the stock price has risen a very respectable 17%.
With that in mind, it's worth seeing if the company's underlying fundamentals have been the driver of long term performance, or if there are some discrepancies.
See our latest analysis for eBay
To paraphrase Benjamin Graham: Over the short term the market is a voting machine, but over the long term it's a weighing machine. One imperfect but simple way to consider how the market perception of a company has shifted is to compare the change in the earnings per share (EPS) with the share price movement.
Over half a decade, eBay managed to grow its earnings per share at 14% a year. This EPS growth is higher than the 6% average annual increase in the share price. So it seems the market isn't so enthusiastic about the stock these days. This cautious sentiment is reflected in its (fairly low) P/E ratio of 10.18.
You can see below how EPS has changed over time (discover the exact values by clicking on the image).
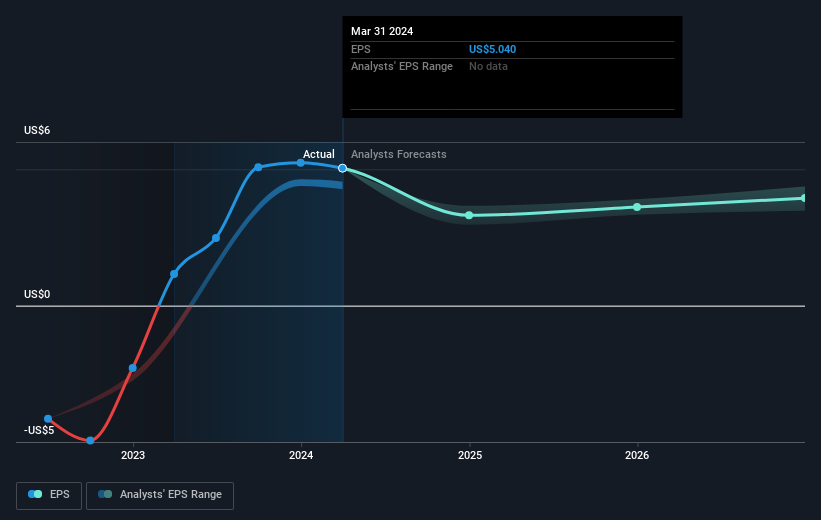
We know that eBay has improved its bottom line lately, but is it going to grow revenue? You could check out this free report showing analyst revenue forecasts.
What About Dividends?
When looking at investment returns, it is important to consider the difference between total shareholder return (TSR) and share price return. Whereas the share price return only reflects the change in the share price, the TSR includes the value of dividends (assuming they were reinvested) and the benefit of any discounted capital raising or spin-off. So for companies that pay a generous dividend, the TSR is often a lot higher than the share price return. In the case of eBay, it has a TSR of 46% for the last 5 years. That exceeds its share price return that we previously mentioned. The dividends paid by the company have thusly boosted the total shareholder return.
A Different Perspective
eBay provided a TSR of 19% over the last twelve months. But that return falls short of the market. The silver lining is that the gain was actually better than the average annual return of 8% per year over five year. This suggests the company might be improving over time. It's always interesting to track share price performance over the longer term. But to understand eBay better, we need to consider many other factors. Consider for instance, the ever-present spectre of investment risk. We've identified 4 warning signs with eBay (at least 1 which is significant) , and understanding them should be part of your investment process.
If you would prefer to check out another company -- one with potentially superior financials -- then do not miss this free list of companies that have proven they can grow earnings.
Please note, the market returns quoted in this article reflect the market weighted average returns of stocks that currently trade on American exchanges.
Have feedback on this article? Concerned about the content? Get in touch with us directly. Alternatively, email editorial-team (at) simplywallst.com.
This article by Simply Wall St is general in nature. We provide commentary based on historical data and analyst forecasts only using an unbiased methodology and our articles are not intended to be financial advice. It does not constitute a recommendation to buy or sell any stock, and does not take account of your objectives, or your financial situation. We aim to bring you long-term focused analysis driven by fundamental data. Note that our analysis may not factor in the latest price-sensitive company announcements or qualitative material. Simply Wall St has no position in any stocks mentioned.
