
 Yahoo Finance
 E-mini S&P 500 Index (ES) Futures Technical Analysis – Trader Reaction to 4366.00 Pivot Sets the Tone
December E-mini S&P 500 Index futures finished higher on Friday after reaching its lowest level since July 20. Value investors came in late in the session to stop an early price slide, which led to the formation of a potentially bullish closing price reversal bottom.
On Monday, investors will be looking to confirm the chart pattern by taking out Friday’s high. If successful, this could trigger the start of a 2 to 3 day counter-trend rally.
On Friday, December E-mini S&P 500 Index futures settled at 4343.75, up 46.00 or +1.06%.
Daily Swing Chart Technical Analysis
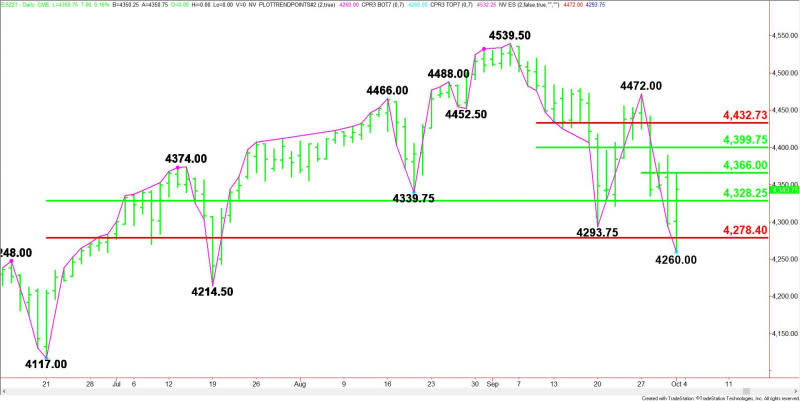
The main trend is down according to the daily swing chart. A trade through 4260.00 will negate the closing price reversal bottom and signal a resumption of the downtrend. The main trend will change to up on a trade through the last main top at 4472.00.
The main range is 4117.00 to 4539.50. Its retracement zone at 4328.25 to 4278.50 is potential support.
The minor range is 4472.00 to 4260.00. Its 50% level or pivot at 4366.00 is the first upside target.
The short-term range is 4539.50 to 4260.00. Its retracement zone at 4399.75 to 4432.75 is the primary upside target and last potential resistance area before the main top at 4472.00.
Daily Swing Chart Technical Forecast
The direction of the December E-mini S&P 500 Index early Monday is likely to be determined by trader reaction to 4366.00.
Bearish Scenario
A sustained move under 4366.00 will indicate the presence of sellers. If this move creates enough downside momentum then look for a move into 4328.25.
Taking out 4328.25 will indicate the selling pressure is getting stronger. This could trigger a further break into 4278.50, followed by 4260.00.
Taking out 4260.00 will not only confirm the downtrend, but it could also trigger an acceleration to the downside with 4214.50 the next likely downside target.
Bullish Scenario
A sustained move over 4366.00 will signal the presence of buyers. If this move creates enough upside momentum then look for a surge into 4399.75. Since the main trend is down, sellers could come in on the first test of this level.
Taking out 4399.75 will indicate the buying is getting stronger. This could trigger a further rally into 4432.75. Once again look for sellers.
A move through 4432.75 could trigger an acceleration into the main top at 4472.00. Taking out this level will change the main trend to up.
For a look at all of today’s economic events, check out our economic calendar.
This article was originally posted on FX Empire
More From FXEMPIRE:
A Quiet Economic Calendar Leaves OPEC, the Loonie and the Greenback in Focus
EOS, Stellar’s Lumen, and Tron’s TRX – Daily Analysis – October 4th, 2021
Crude Oil Price Update – Bullish OPEC+ Decision Could Trigger Breakout Over $76.98 into $80.00
Earnings Week Ahead: PepsiCo, Acuity Brands and Constellation Brands in Focus
