
 Yahoo Finance
 E-mini S&P 500 Index (ES) Futures Technical Analysis – Trade Through 4515.25 Shifts Momentum to Down
December E-mini S&P 500 Index futures finished lower on Friday, pressured by weakness in the communications and technology sectors, following disappointing quarterly reports from Snap Inc and Intel Corp. Sellers were also encouraged to pare positions following potentially hawkish remarks from Federal Reserve Chair Jerome Powell, where he discussed stimulus tapering and the timetable for future rate hikes.
On Friday, December E-mini S&P 500 Index futures settled at 4536.50, down 5.25 or -0.12%.
In stock related news, Snap shares fell more than 25% and its report caused shareholders to exit bigger advertising dependent communications companies such as Facebook Inc and Twitter Inc, which both closed down around 5%.
Intel shares tumbled almost 12% after the computer chip maker missed third-quarter sales expectations, while its chief executive officer pointed to shortages of chips holding back sales of its flagship processors.
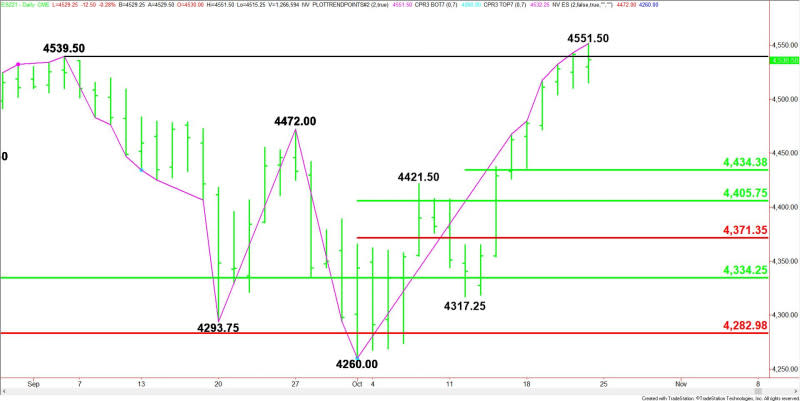
Daily Swing Chart Technical Analysis
The main trend is up according to the daily swing chart. The uptrend was reaffirmed on Friday when buyers took out the previous high at 4543.25.
A trade through 4260.00 will change the main trend to down. This is highly unlikely, but the formation of the closing price reversal top suggests momentum may be getting ready to shift to the downside.
A move through 4551.50 will negate the closing price reversal top and signal a resumption of the uptrend. A move through 4515.25 will confirm the potentially bearish chart pattern.
The confirmation of the closing price reversal top won’t change the main trend to down, but it will shift momentum to the downside and it could trigger the start of a 2 to 3 day correction. If the selling pressure is strong enough then we could see a 50% correction of the minor and main ranges.
The minor range is 4317.25 to 4551.50. Its 50% level at 4434.25 is the next potential downside target.
The main range is 4260.00 to 4551.50. If the minor 50% level fails then look for the selling to possibly extend into its retracement zone at 4405.75 to 4371.25.
Short-Term Outlook
The formation of the closing price reversal top indicates the uptrend will likely resume on a sustained move over 4551.50 and a counter-trend sell-off may begin on a sustained move under 4515.25.
For a look at all of today’s economic events, check out our economic calendar.
This article was originally posted on FX Empire
More From FXEMPIRE:
U.S Dollar Fights For Supremacy Amid A Moderate Federal Reserve Bank
AUD/USD and NZD/USD Fundamental Daily Forecast – Aussie Bond Market Volatility Forces RBA to Step In
The Weekly Wrap – Inflationary Pressures Shift Monetary Policy Expectations, Pegging Back the Dollar
USD/JPY Fundamental Daily Forecast – Investors Want Clarity and Conviction from Federal Reserve
