
 Yahoo Finance
 E-mini S&P 500 Index (ES) Futures Technical Analysis – Pivot at 3080.00 Controlling Price Action
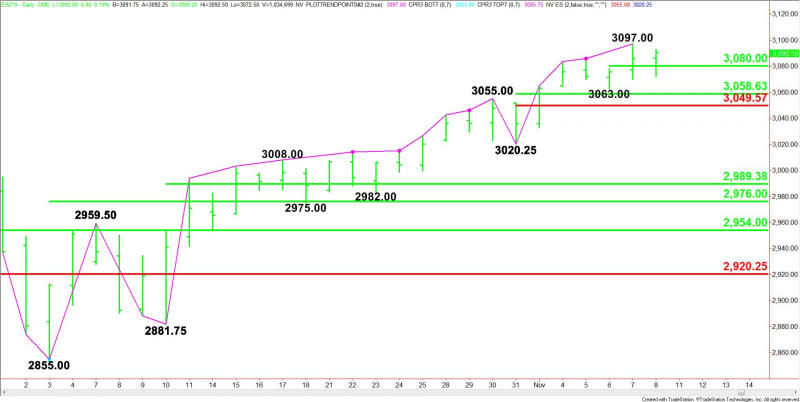
December E-mini S&P 500 Index futures finished slightly better on Friday, while posting an inside move. The price action suggests investor indecision and impending volatility. Uncertainty over the progress of U.S.-China trade talks likely drove the uncertainty.
On Thursday, Reuters reported that the two economic powerhouses had agreed to rollback tariffs. This news spiked the index into a record high. On Friday, buyers were a little more tentative after President Donald Trump said he had not approved any tariff reductions.
On Friday, December E-mini S&P 500 Index futures settled at 3090.50, up 4.50 or +0.15%.
Daily Swing Chart Technical Analysis
The main trend is up according to the daily swing chart. A trade through 3097.00 will signal a resumption of the uptrend. The main trend will change to down on a trade through 3020.25.
The minor trend is also up. A trade through 3063.00 will change the minor trend to down. This will also shift momentum to the downside.
The minor range is 3063.00 to 3097.00. On Friday, the index straddled its 50% level or pivot at 3080.00 most of the session before closing above it.
The short-term range is 3020.25 to 3097.00. Its retracement zone at 3058.50 to 3049.50 is a support area.
Daily Swing Chart Technical Forecast
Based on Friday’s price action and the close at 3090.50, the direction of the December E-mini S&P 500 Index on Monday is likely to be determined by trader reaction to the minor pivot at 3080.00.
Bullish Scenario
A sustained move over 3080.00 will indicate the presence of buyers. The first upside target is the record high at 3097.00. Taking out this level could trigger an acceleration to the upside especially if the move is new driven.
Bearish Scenario
A sustained move under 3080.00 will signal the presence of sellers. If this generates enough downside momentum then look for the selling to extend into the minor bottom at 3063.00.
If 3063.00 fails to hold then look for a test of the short-term retracement zone at 3058.50 to 3049.50. Since the main trend is up, buyers could come in on a test of this zone. If 3049.50 fails as support then look for a potential acceleration to the downside.
Side Notes
Monday is a U.S. holiday. The Treasury market is closed but the stock market is open. Nonetheless, volume is likely to be well below average so watch for whip-saw price action. Be careful buying strength or selling weakness if the volume is not behind the moves.
This article was originally posted on FX Empire
