
 Yahoo Finance
 E-mini NASDAQ-100 Index (NQ) Futures Technical Analysis – May 21, 2018 Forecast
June E-mini NASDAQ-100 Index futures are expected to open higher based on the pre-market trade. Investors are in buying mode because of the outcome of the trade talks between the United States and China.
Daily Swing Chart Technical Analysis
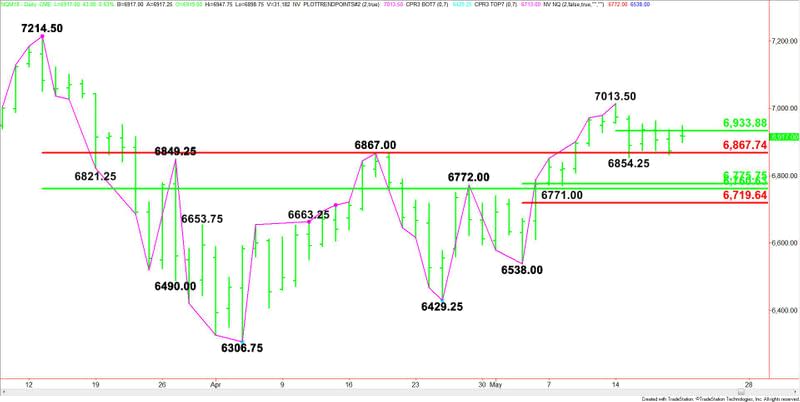
The main trend is up according to the daily swing chart. Four days of sideways price action suggests investor indecision and impending volatility.
A trade through 7013.50 will signal a resumption of the uptrend. A move through 6854.25 will change the minor trend to down and signal a shift in momentum to the downside.
The short-term range is 7013.50 to 6854.25. Its 50% level or pivot at 6834.00 is controlling the price action today.
The main range is 6538.00 to 7013.50. Its retracement zone at 6775.75 to 6719.50 is the primary downside target.
The major retracement zone is 6867.75 to 6760.50.
Daily Swing Chart Technical Forecast
Based on the early price action, the direction of the index today is likely to be determined by trader reaction to the pivot at 6934.00.
A sustained move under 6934.00 will indicate the presence of sellers. This could trigger a move into the major Fib level at 6867.75, followed by the minor bottom at 6854.25.
Look for a possible acceleration to the downside if 6854.25 fails as support. This could trigger a move into a support cluster at 6775.75 to 6760.50.
A sustained move over 6934.00 will signal the presence of buyers. This could lead to an acceleration into 7013.50.
This article was originally posted on FX Empire
More From FXEMPIRE:
Gold Price Futures (GC) Technical Analysis – May 21, 2018 Forecast
Grains Break Higher Following Reduction in Trade War Rhetoric
E-mini Dow Jones Industrial Average (YM) Futures Analysis – May 21, 2018 Forecast
Equity Markets and USD Rise as US Could Tolerate NAFTA Deadline in 2019 for the Right Deal
RoboForex has Introduced an Opportunity to Buy Bitcoin Using Fiat Currencies
