
 Yahoo Finance
 E-mini NASDAQ-100 Index (NQ) Futures Technical Analysis – Strengthens Over 7462.00, Weakens Under 7431.75
An index of U.S. technology stocks settled sharply lower on Thursday. The index was dragged down by shares of Amazon and Apple which fell 1.8 percent and 1.7 percent, respectively. Additional pressure was provided by Facebook shares which declined 2.8 percent and Alphabet, which declined 1.3 percent.
At 0615 GMT, the September E-mini NASDAQ-100 Index is trading 7455.00, down 2.50 or -0.03%. For the week, the index is down about 2.66%.
Daily Swing Chart Technical Analysis
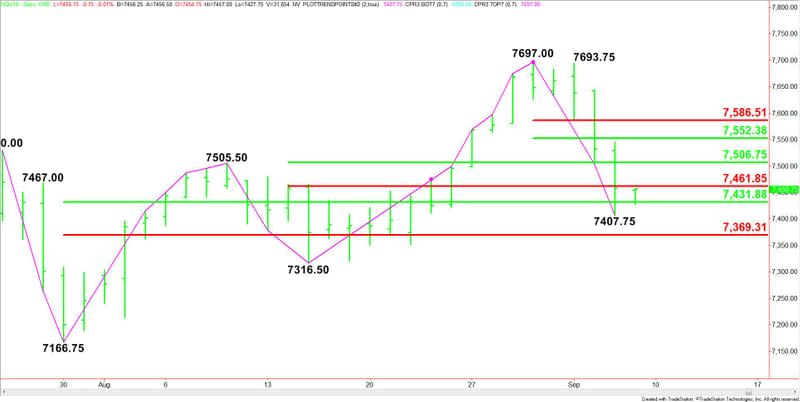
The main trend is up according to the daily swing chart, however, momentum has been trending lower since the formation of a closing price reversal top on August 30. A trade through 7316.50 will change the main trend to down.
The minor trend is down. This is also contributing to the downside momentum. A trade through 7407.75 will indicate the selling is getting stronger.
The main range is 7166.75 to 7697.00. Its retracement zone at 7431.75 to 7369.25 was tested on Thursday.
The intermediate range is 7316.50 to 7697.00. Its retracement zone at 7462.00 to 7506.75 is the first potential resistance area.
If a new short-term range forms between 7697.00 and 7407.75 then its retracement zone at 7552.50 to 7586.50 will become the primary upside target.
Daily Swing Chart Technical Forecast
Based on Thursday’s close at 7457.50 and the early price action, the direction of the September E-mini NASDAQ-100 Index on Friday is likely to be determined by trader reaction to the Fibonacci level at 7462.00.
A sustained move under 7462.00 will indicate the presence of sellers. This could lead to a test of the 50% level at 7431.75 then yesterday’s low at 7407.75.
Taking out 7407.75 will indicate the selling is getting stronger. This could trigger a break into the main Fibonacci level at 7369.25. This is a potential trigger point for an acceleration into the main bottom at 7316.50.
A sustained move over 7462.00 will signal the presence of buyers. This could trigger a surge into the 50% level at 7506.75. Overtaking this level could lead to a potential test of the short-term retracement zone at 7552.50 to 7586.50.
This article was originally posted on FX Empire
More From FXEMPIRE:
Crude Oil Price Update – Tested Key Retracement Zone at $67.65 to $66.76 on Thursday
Technical Checks For Gold, WTI Crude Oil & US Dollar Index: 07.09.2018
Gold Continues Positive Movement for Third Consecutive Market Session on Trade War Woes
USD/CAD Daily Price Forecast – USD/CAD Drops As Trade War Woes Drag Down US Dollar
Bitcoin and Ethereum Price Forecast – BTC Prices In a Stalemate
