
 Yahoo Finance
 E-mini Dow Jones Industrial Average (YM) Futures Technical Analysis – Trend Changed to Down
March E-mini Dow Jones Industrial Average futures are trading lower late Friday, but clawing back most of their earlier losses. The blue chip average was under pressure from the start of cash market trading after weakening during the pre-market futures session.
The catalysts behind the pressure were concerns that President Joe Biden’s $1.9 trillion stimulus plan would lead to increased corporate taxes and lower bank stock prices after major U.S. lenders released their earnings reports to kick off earnings season.
At 19:34 GMT, March E-mini Dow Jones Industrial Average futures are trading 30795, down 114 or -0.37%. This is up from a low of 30506.
Biden’s stimulus proposal, unveiled on Thursday evening, includes some $1 trillion in direct relief to households and has sparked fears that the government would need to hike corporate taxes to fund the spending.
Additionally, shares of JPMorgan Chase & Co, Citigroup Inc and Wells Fargo & Co, which had seen a strong rally in the run-up to earnings, were all down even as the banks posted better-than-expected fourth-quarter profits.
JPMorgan fell 2.2% following a seven-day winning streak that had pushed the stock about 12% higher. Overall, the S&P 500 Banks Index shed about 3.3%.
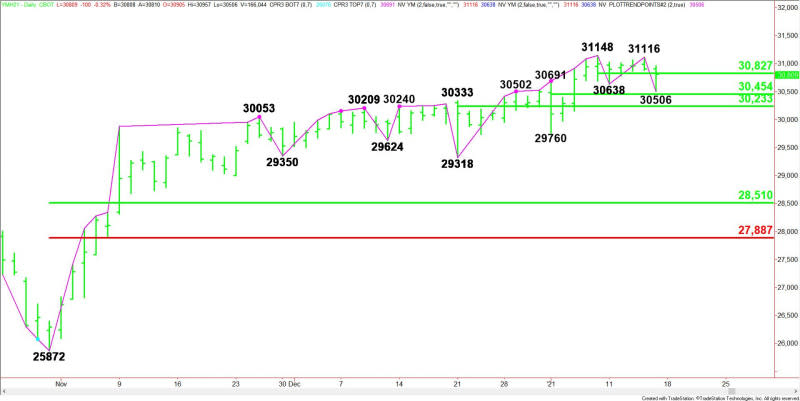
Daily Swing Chart Technical Analysis
The main trend is down according to the daily swing chart. The trend turned down earlier in the session when sellers took out 30638. The main trend will change to up on a move through 31116, and reaffirmed on a trade through 31148.
The minor range is 31148 to 30506. Its 50% level at 30827 is resistance.
The second minor range is 29760 to 31148. Its 50% level at 30454 is support.
The short-term range is 29318 to 31148. Its 50% level at 30233 is another potential support level and a possible trigger point for an acceleration to the downside.
Daily Swing Chart Technical Forecast
The direction of the March E-mini Dow Jones industrial Average futures contract into the close will be determined by trader reaction to the pivot at 30827.
Bearish Scenario
A sustained move under 30827 will indicate the presence of sellers. This could trigger a late session break into a pair of 50% levels at 30454 to 30233.
Bullish Scenario
A sustained move over 30827 will signal the presence of buyers. The first upside target is the main top at 31116, followed by 31148.
For a look at all of today’s economic events, check out our economic calendar.
This article was originally posted on FX Empire
