
 Yahoo Finance
 E-mini Dow Jones Industrial Average (YM) Futures Analysis – January 19, 2018 Forecast
March E-mini Dow Jones Industrial Average futures are trading higher shortly before the cash market opening. The buying is a little tentative as investors prepare for a possible government shutdown at the end of Friday.
Daily Technical Analysis
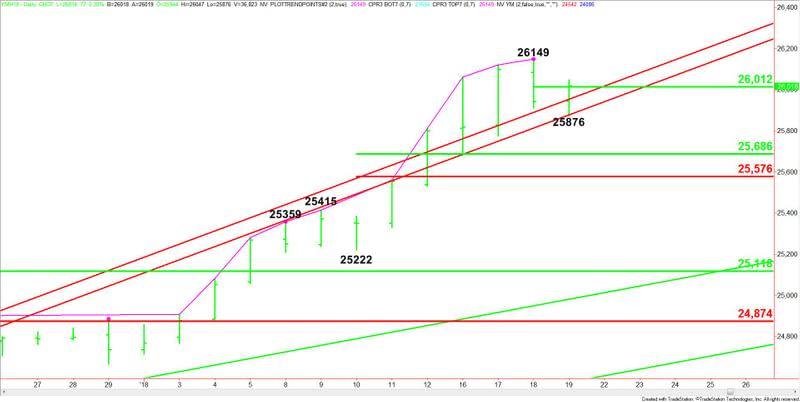
The main trend is up according to the daily swing chart. However, yesterday’s closing price reversal top may be the first sign that momentum is getting ready to shift to the downside.
The potentially bearish chart pattern was confirmed earlier today without much follow-through to the downside.
The new short-term range is 26149 to 25876. Its 50% level or pivot is 26012. This price will control the direction of the Dow today.
The minor range is 25222 to 26149. Its retracement zone at 25686 to 25576 is a potential downside target.
Daily Technical Forecast
Based on the early trade, the direction of the Dow is likely to be determined by trader reaction to 26012.
A sustained move over 26012 will indicate the buying is getting stronger. This could generate the upside momentum to challenge or even take out 26149.
A sustained move under 26012 will indicate the presence of sellers. The first potential support is a long-term uptrending Gann angle at 25954. The next support is a short-term uptrending Gann angle at 25877. This angle provided support earlier in the session.
The trigger point for an acceleration to the downside is 25877. If this angle is taken out with conviction, the Dow could plunge into the 50% level at 25686.
This article was originally posted on FX Empire
More From FXEMPIRE:
E-mini NASDAQ-100 Index (NQ) Futures Technical Analysis – January 19, 2018 Forecast
Gold Price Futures (GC) Technical Analysis – January 19, 2018 Forecast
E-mini S&P 500 Index (ES) Futures Technical Analysis – January 19, 2018 Forecast
Oil Price Fundamental Daily Forecast – Hedge Fund Selling Will Alleviate Upside Pressure
