
 Yahoo Finance
 Driven Brands Holdings (NASDAQ:DRVN) Has More To Do To Multiply In Value Going Forward
To find a multi-bagger stock, what are the underlying trends we should look for in a business? One common approach is to try and find a company with returns on capital employed (ROCE) that are increasing, in conjunction with a growing amount of capital employed. Ultimately, this demonstrates that it's a business that is reinvesting profits at increasing rates of return. However, after briefly looking over the numbers, we don't think Driven Brands Holdings (NASDAQ:DRVN) has the makings of a multi-bagger going forward, but let's have a look at why that may be.
Understanding Return On Capital Employed (ROCE)
For those who don't know, ROCE is a measure of a company's yearly pre-tax profit (its return), relative to the capital employed in the business. Analysts use this formula to calculate it for Driven Brands Holdings:
Return on Capital Employed = Earnings Before Interest and Tax (EBIT) ÷ (Total Assets - Current Liabilities)
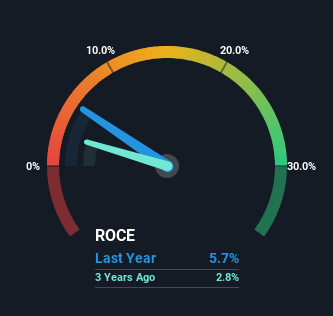
0.057 = US$311m ÷ (US$5.9b - US$427m) (Based on the trailing twelve months to December 2023).
So, Driven Brands Holdings has an ROCE of 5.7%. Ultimately, that's a low return and it under-performs the Commercial Services industry average of 10%.
See our latest analysis for Driven Brands Holdings
Above you can see how the current ROCE for Driven Brands Holdings compares to its prior returns on capital, but there's only so much you can tell from the past. If you're interested, you can view the analysts predictions in our free analyst report for Driven Brands Holdings .
What Can We Tell From Driven Brands Holdings' ROCE Trend?
In terms of Driven Brands Holdings' historical ROCE trend, it doesn't exactly demand attention. The company has employed 350% more capital in the last five years, and the returns on that capital have remained stable at 5.7%. This poor ROCE doesn't inspire confidence right now, and with the increase in capital employed, it's evident that the business isn't deploying the funds into high return investments.
The Bottom Line
In summary, Driven Brands Holdings has simply been reinvesting capital and generating the same low rate of return as before. Since the stock has declined 41% over the last three years, investors may not be too optimistic on this trend improving either. On the whole, we aren't too inspired by the underlying trends and we think there may be better chances of finding a multi-bagger elsewhere.
Driven Brands Holdings could be trading at an attractive price in other respects, so you might find our free intrinsic value estimation for DRVN on our platform quite valuable.
While Driven Brands Holdings isn't earning the highest return, check out this free list of companies that are earning high returns on equity with solid balance sheets.
Have feedback on this article? Concerned about the content? Get in touch with us directly. Alternatively, email editorial-team (at) simplywallst.com.
This article by Simply Wall St is general in nature. We provide commentary based on historical data and analyst forecasts only using an unbiased methodology and our articles are not intended to be financial advice. It does not constitute a recommendation to buy or sell any stock, and does not take account of your objectives, or your financial situation. We aim to bring you long-term focused analysis driven by fundamental data. Note that our analysis may not factor in the latest price-sensitive company announcements or qualitative material. Simply Wall St has no position in any stocks mentioned.
