
 Yahoo Finance
 Dow Jones 30 and NASDAQ 100 Price forecast August 14, 2017, Technical Analysis
Dow Jones 30
The Dow Jones 30 initially went sideways, but then shot a little bit higher during the day on Friday. It looks like the market is trying to recover a bit from the selloff that we have seen over the last several sessions, and a move towards the 22,000 level might be possible. That’s an area that should be rather resistive though, so we will have to see whether the market can break above there. In the meantime, I think that if we can break above there, then it’s more of a buy-and-hold situation. I have no interest in shorting until we break to a fresh, new low, which I don’t necessarily things going to happen quite yet. If it does, then the market will more than likely go looking towards the 21,700 level.
Dow Jones 30 and NASDAQ Index Video 14.8.17
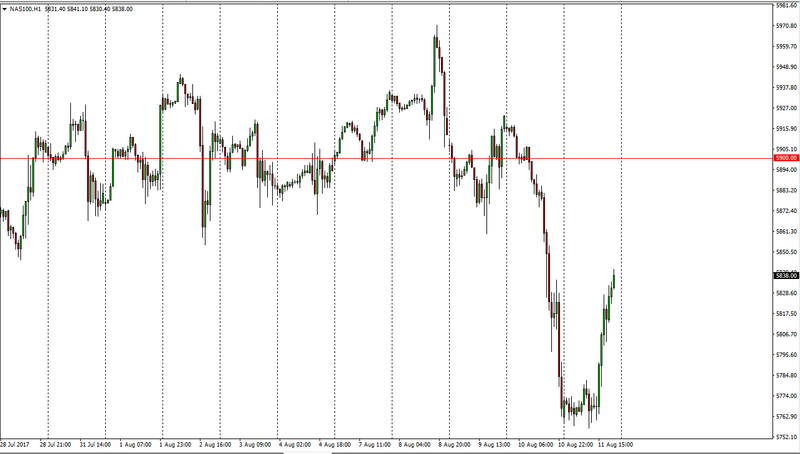
NASDAQ 100
The NASDAQ 100 has exploded to the upside during the day on Friday as traders came back to work. It looks likely that we are going to try to go towards the 5900 level, and I think that the NASDAQ 100 is trying to lead the way for the other indices to the upside. Ultimately, I still have a target of 6000, but the recent arguing between the Americans and the North Koreans has put a lot of fear into the marketplace. Quite frankly, I think it’s likely to be thought of as a buying opportunity on the longer-term charts, as nobody is going to be nuking anybody else. This market has needed a reasonable back, quite frankly it found it and I think that most of the damage is probably already been done. However, a fresh, new low will have the market resetting and looking for support at the 5700 level.
This article was originally posted on FX Empire
More From FXEMPIRE:
Dow Jones 30 and NASDAQ 100 forecast for the week of August 14, 2017, Technical Analysis
Dow Jones 30 and NASDAQ 100 Price forecast August 14, 2017, Technical Analysis
Market Snapshot – Choppy Action as Fundamentals And Data Collide
E-mini Dow Jones Industrial Average (YM) Futures Analysis – August 11, 2017 Forecast
E-mini NASDAQ-100 Index (NQ) Futures Technical Analysis – August 11, 2017 Forecast
Dow Jones 30 and NASDAQ 100 Forecast August 11, 2017, Technical Analysis
