
 Yahoo Finance
 What does Shangri-La Asia Limited’s (HKG:69) Balance Sheet Tell Us About Its Future?

Small and large cap stocks are widely popular for a variety of reasons, however, mid-cap companies such as Shangri-La Asia Limited (SEHK:69), with a market cap of HK$55.64B, often get neglected by retail investors. However, generally ignored mid-caps have historically delivered better risk-adjusted returns than the two other categories of stocks. 69’s financial liquidity and debt position will be analysed in this article, to get an idea of whether the company can fund opportunities for strategic growth and maintain strength through economic downturns. Note that this commentary is very high-level and solely focused on financial health, so I suggest you dig deeper yourself into 69 here. Check out our latest analysis for Shangri-La Asia
Does 69 generate enough cash through operations?
69 has sustained its debt level by about US$5.21B over the last 12 months made up of current and long term debt. At this constant level of debt, the current cash and short-term investment levels stands at US$947.13M , ready to deploy into the business. On top of this, 69 has produced US$473.66M in operating cash flow during the same period of time, resulting in an operating cash to total debt ratio of 9.09%, indicating that 69’s operating cash is not sufficient to cover its debt. This ratio can also be a sign of operational efficiency as an alternative to return on assets. In 69’s case, it is able to generate 0.091x cash from its debt capital.
Can 69 pay its short-term liabilities?
With current liabilities at US$1.35B, it appears that the company has maintained a safe level of current assets to meet its obligations, with the current ratio last standing at 1.07x. For Hospitality companies, this ratio is within a sensible range as there’s enough of a cash buffer without holding too capital in low return investments.
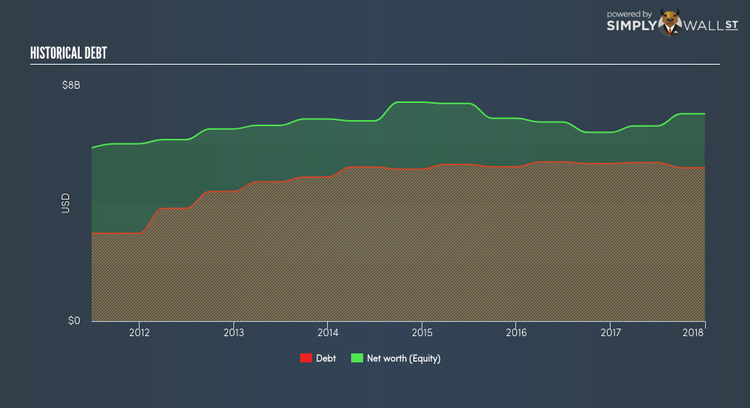
Can 69 service its debt comfortably?
With debt reaching 74.03% of equity, 69 may be thought of as relatively highly levered. This is not uncommon for a mid-cap company given that debt tends to be lower-cost and at times, more accessible. No matter how high the company’s debt, if it can easily cover the interest payments, it’s considered to be efficient with its use of excess leverage. A company generating earnings after interest and tax at least three times its net interest payments is considered financially sound. In 69’s case, the ratio of 1.7x suggests that interest is not strongly covered, which means that lenders may refuse to lend the company more money, as it is seen as too risky in terms of default.
Next Steps:
69’s cash flow coverage indicates it could improve its operating efficiency in order to meet demand for debt repayments should unforeseen events arise. However, the company exhibits an ability to meet its near term obligations should an adverse event occur. I admit this is a fairly basic analysis for 69’s financial health. Other important fundamentals need to be considered alongside. I recommend you continue to research Shangri-La Asia to get a more holistic view of the stock by looking at:
Future Outlook: What are well-informed industry analysts predicting for 69’s future growth? Take a look at our free research report of analyst consensus for 69’s outlook.
Valuation: What is 69 worth today? Is the stock undervalued, even when its growth outlook is factored into its intrinsic value? The intrinsic value infographic in our free research report helps visualize whether 69 is currently mispriced by the market.
Other High-Performing Stocks: Are there other stocks that provide better prospects with proven track records? Explore our free list of these great stocks here.
To help readers see pass the short term volatility of the financial market, we aim to bring you a long-term focused research analysis purely driven by fundamental data. Note that our analysis does not factor in the latest price sensitive company announcements.
The author is an independent contributor and at the time of publication had no position in the stocks mentioned.
