
 Yahoo Finance
 Does Plains All American Pipeline LP’s (NYSE:PAA) Debt Level Pose A Problem?

The size of Plains All American Pipeline LP (NYSE:PAA), a US$17.78b large-cap, often attracts investors seeking a reliable investment in the stock market. One reason being its ‘too big to fail’ aura which gives it the appearance of a strong and stable investment. However, its financial health remains the key to continued success. Let’s take a look at Plains All American Pipeline’s leverage and assess its financial strength to get an idea of their ability to fund strategic acquisitions and grow through cyclical pressures. Note that this commentary is very high-level and solely focused on financial health, so I suggest you dig deeper yourself into PAA here. See our latest analysis for Plains All American Pipeline
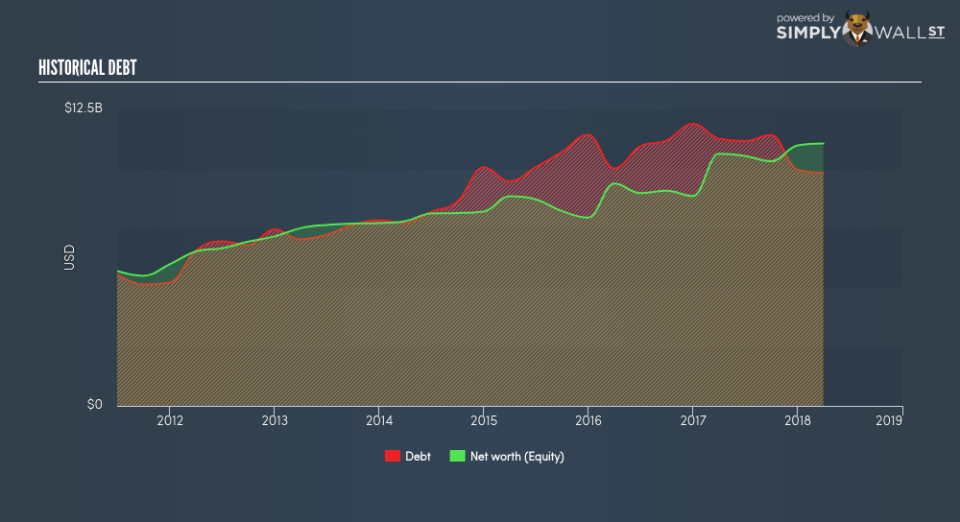
How does PAA’s operating cash flow stack up against its debt?
Over the past year, PAA has reduced its debt from US$11.89b to US$9.96b , which is made up of current and long term debt. With this reduction in debt, the current cash and short-term investment levels stands at US$37.00m , ready to deploy into the business. On top of this, PAA has generated cash from operations of US$2.50b over the same time period, resulting in an operating cash to total debt ratio of 25.10%, meaning that PAA’s operating cash is sufficient to cover its debt. This ratio can also be a sign of operational efficiency as an alternative to return on assets. In PAA’s case, it is able to generate 0.25x cash from its debt capital.
Can PAA meet its short-term obligations with the cash in hand?
With current liabilities at US$4.53b, the company is not able to meet these obligations given the level of current assets of US$4.00b, with a current ratio of 0.88x below the prudent level of 3x.
Can PAA service its debt comfortably?
PAA is a relatively highly levered company with a debt-to-equity of 88.85%. This is not unusual for large-caps since debt tends to be less expensive than equity because interest payments are tax deductible. Accordingly, large companies often have an advantage over small-caps through lower cost of capital due to cheaper financing. We can assess the sustainability of PAA’s debt levels to the test by looking at how well interest payments are covered by earnings. Preferably, earnings before interest and tax (EBIT) should be at least three times as large as net interest. In PAA’s case, the ratio of 2.33x suggests that interest is not strongly covered. Although it is highly unlikely we’d see Plains All American Pipeline defaulting or announcing bankruptcy tomorrow, this situation may put the company in a tough position when borrowing more money in the future to fuel its growth.
Next Steps:
Although PAA’s debt level is towards the higher end of the spectrum, its cash flow coverage seems adequate to meet debt obligations which means its debt is being efficiently utilised. However, its lack of liquidity raises questions over current asset management practices for the large-cap. Keep in mind I haven’t considered other factors such as how PAA has been performing in the past. I suggest you continue to research Plains All American Pipeline to get a better picture of the stock by looking at:
Future Outlook: What are well-informed industry analysts predicting for PAA’s future growth? Take a look at our free research report of analyst consensus for PAA’s outlook.
Valuation: What is PAA worth today? Is the stock undervalued, even when its growth outlook is factored into its intrinsic value? The intrinsic value infographic in our free research report helps visualize whether PAA is currently mispriced by the market.
Other High-Performing Stocks: Are there other stocks that provide better prospects with proven track records? Explore our free list of these great stocks here.
To help readers see pass the short term volatility of the financial market, we aim to bring you a long-term focused research analysis purely driven by fundamental data. Note that our analysis does not factor in the latest price sensitive company announcements.
The author is an independent contributor and at the time of publication had no position in the stocks mentioned.
