
 Yahoo Finance
 Does The Market Have A Low Tolerance For Haleon plc's (LON:HLN) Mixed Fundamentals?
With its stock down 8.9% over the past month, it is easy to disregard Haleon (LON:HLN). We, however decided to study the company's financials to determine if they have got anything to do with the price decline. Fundamentals usually dictate market outcomes so it makes sense to study the company's financials. Specifically, we decided to study Haleon's ROE in this article.
Return on equity or ROE is an important factor to be considered by a shareholder because it tells them how effectively their capital is being reinvested. In simpler terms, it measures the profitability of a company in relation to shareholder's equity.
View our latest analysis for Haleon
How Is ROE Calculated?
The formula for ROE is:
Return on Equity = Net Profit (from continuing operations) ÷ Shareholders' Equity
So, based on the above formula, the ROE for Haleon is:
7.2% = UK£1.2b ÷ UK£16b (Based on the trailing twelve months to March 2023).
The 'return' is the amount earned after tax over the last twelve months. One way to conceptualize this is that for each £1 of shareholders' capital it has, the company made £0.07 in profit.
Why Is ROE Important For Earnings Growth?
Thus far, we have learned that ROE measures how efficiently a company is generating its profits. Depending on how much of these profits the company reinvests or "retains", and how effectively it does so, we are then able to assess a company’s earnings growth potential. Generally speaking, other things being equal, firms with a high return on equity and profit retention, have a higher growth rate than firms that don’t share these attributes.
Haleon's Earnings Growth And 7.2% ROE
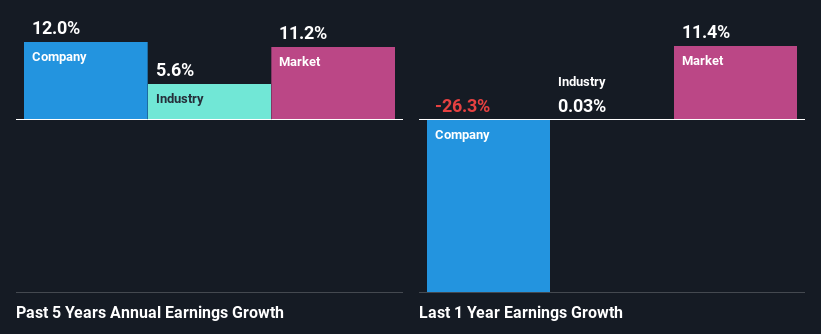
When you first look at it, Haleon's ROE doesn't look that attractive. We then compared the company's ROE to the broader industry and were disappointed to see that the ROE is lower than the industry average of 11%. However, the moderate 12% net income growth seen by Haleon over the past five years is definitely a positive. We reckon that there could be other factors at play here. For example, it is possible that the company's management has made some good strategic decisions, or that the company has a low payout ratio.
As a next step, we compared Haleon's net income growth with the industry, and pleasingly, we found that the growth seen by the company is higher than the average industry growth of 5.6%.
Earnings growth is a huge factor in stock valuation. It’s important for an investor to know whether the market has priced in the company's expected earnings growth (or decline). By doing so, they will have an idea if the stock is headed into clear blue waters or if swampy waters await. One good indicator of expected earnings growth is the P/E ratio which determines the price the market is willing to pay for a stock based on its earnings prospects. So, you may want to check if Haleon is trading on a high P/E or a low P/E, relative to its industry.
Is Haleon Making Efficient Use Of Its Profits?
The really high three-year median payout ratio of 956,136% for Haleon suggests that the company is paying its shareholders more than what it is earning. Still the company's earnings have grown respectably. It would still be worth keeping an eye on that high payout ratio, if for some reason the company runs into problems and business deteriorates. Our risks dashboard should have the 3 risks we have identified for Haleon.
Our latest analyst data shows that the future payout ratio of the company is expected to drop to 36% over the next three years. The fact that the company's ROE is expected to rise to 9.9% over the same period is explained by the drop in the payout ratio.
Summary
Overall, we have mixed feelings about Haleon. While no doubt its earnings growth is pretty substantial, its ROE and earnings retention is quite poor. So while the company has managed to grow its earnings in spite of this, we are unconvinced if this growth could extend, especially during troubled times. The latest industry analyst forecasts show that the company is expected to maintain its current growth rate. Are these analysts expectations based on the broad expectations for the industry, or on the company's fundamentals? Click here to be taken to our analyst's forecasts page for the company.
Have feedback on this article? Concerned about the content? Get in touch with us directly. Alternatively, email editorial-team (at) simplywallst.com.
This article by Simply Wall St is general in nature. We provide commentary based on historical data and analyst forecasts only using an unbiased methodology and our articles are not intended to be financial advice. It does not constitute a recommendation to buy or sell any stock, and does not take account of your objectives, or your financial situation. We aim to bring you long-term focused analysis driven by fundamental data. Note that our analysis may not factor in the latest price-sensitive company announcements or qualitative material. Simply Wall St has no position in any stocks mentioned.
Join A Paid User Research Session
You’ll receive a US$30 Amazon Gift card for 1 hour of your time while helping us build better investing tools for the individual investors like yourself. Sign up here
