
 Yahoo Finance
 How Did Keppel Telecommunications & Transportation Ltd’s (SGX:K11) 5.53% ROE Fare Against The Industry?

This analysis is intended to introduce important early concepts to people who are starting to invest and want to begin learning the link between Keppel Telecommunications & Transportation Ltd (SGX:K11)’s return fundamentals and stock market performance.
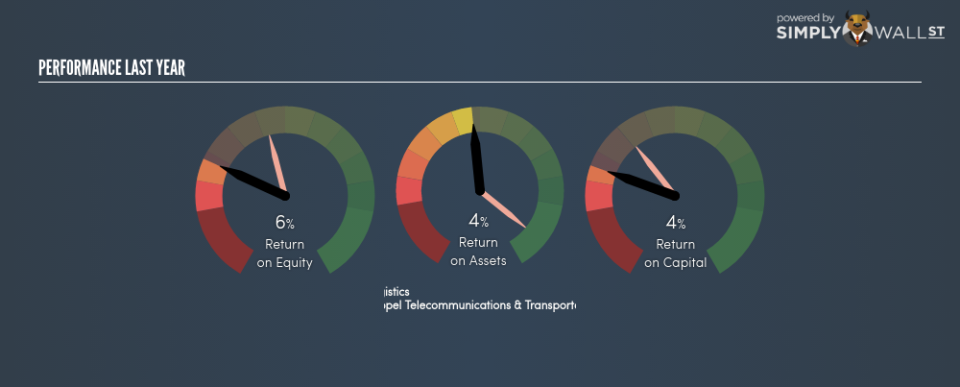
Keppel Telecommunications & Transportation Ltd’s (SGX:K11) most recent return on equity was a substandard 5.53% relative to its industry performance of 13.57% over the past year. K11’s results could indicate a relatively inefficient operation to its peers, and while this may be the case, it is important to understand what ROE is made up of and how it should be interpreted. Knowing these components could change your view on K11’s performance. Today I will look at how components such as financial leverage can influence ROE which may impact the sustainability of K11’s returns. View out our latest analysis for Keppel Telecommunications & Transportation
What you must know about ROE
Return on Equity (ROE) weighs Keppel Telecommunications & Transportation’s profit against the level of its shareholders’ equity. For example, if the company invests SGD1 in the form of equity, it will generate SGD0.055 in earnings from this. In most cases, a higher ROE is preferred; however, there are many other factors we must consider prior to making any investment decisions.
Return on Equity = Net Profit ÷ Shareholders Equity
ROE is measured against cost of equity in order to determine the efficiency of Keppel Telecommunications & Transportation’s equity capital deployed. Its cost of equity is 8.51%. This means Keppel Telecommunications & Transportation’s returns actually do not cover its own cost of equity, with a discrepancy of -2.98%. This isn’t sustainable as it implies, very simply, that the company pays more for its capital than what it generates in return. ROE can be split up into three useful ratios: net profit margin, asset turnover, and financial leverage. This is called the Dupont Formula:
Dupont Formula
ROE = profit margin × asset turnover × financial leverage
ROE = (annual net profit ÷ sales) × (sales ÷ assets) × (assets ÷ shareholders’ equity)
ROE = annual net profit ÷ shareholders’ equity
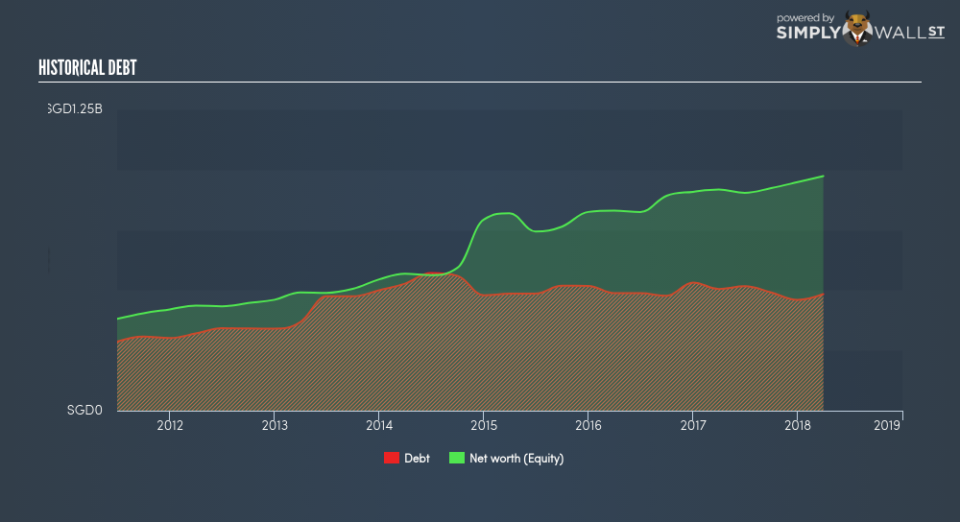
The first component is profit margin, which measures how much of sales is retained after the company pays for all its expenses. Asset turnover shows how much revenue Keppel Telecommunications & Transportation can generate with its current asset base. The most interesting ratio, and reflective of sustainability of its ROE, is financial leverage. Since ROE can be artificially increased through excessive borrowing, we should check Keppel Telecommunications & Transportation’s historic debt-to-equity ratio. At 49.69%, Keppel Telecommunications & Transportation’s debt-to-equity ratio appears sensible and indicates its ROE is generated from its capacity to increase profit without a large debt burden.
Next Steps:
ROE is a simple yet informative ratio, illustrating the various components that each measure the quality of the overall stock. Keppel Telecommunications & Transportation’s below-industry ROE is disappointing, furthermore, its returns were not even high enough to cover its own cost of equity. However, ROE is not likely to be inflated by excessive debt funding, giving shareholders more conviction in the sustainability of returns, which has headroom to increase further. ROE is a helpful signal, but it is definitely not sufficient on its own to make an investment decision.
For Keppel Telecommunications & Transportation, I’ve compiled three pertinent factors you should look at:
Financial Health: Does it have a healthy balance sheet? Take a look at our free balance sheet analysis with six simple checks on key factors like leverage and risk.
Future Earnings: How does Keppel Telecommunications & Transportation’s growth rate compare to its peers and the wider market? Dig deeper into the analyst consensus number for the upcoming years by interacting with our free analyst growth expectation chart.
Other High-Growth Alternatives : Are there other high-growth stocks you could be holding instead of Keppel Telecommunications & Transportation? Explore our interactive list of stocks with large growth potential to get an idea of what else is out there you may be missing!
To help readers see pass the short term volatility of the financial market, we aim to bring you a long-term focused research analysis purely driven by fundamental data. Note that our analysis does not factor in the latest price sensitive company announcements.
The author is an independent contributor and at the time of publication had no position in the stocks mentioned.
