
 Yahoo Finance
 Did AmpliPhi Biosciences Corporation’s (NYSEMKT:APHB) Earnings Growth Outperform The Industry?

Analyzing AmpliPhi Biosciences Corporation’s (AMEX:APHB) track record of past performance is a valuable exercise for investors. It enables us to reflect on whether or not the company has met expectations, which is a powerful signal for future performance. Today I will assess APHB’s recent performance announced on 31 March 2018 and compare these figures to its long-term trend and industry movements. View our latest analysis for AmpliPhi Biosciences
How Well Did APHB Perform?
I like to use data from the most recent 12 months, which either annualizes the most recent 6-month earnings update, or in some cases, the most recent annual report is already the latest available financial data. This technique allows me to analyze many different companies on a more comparable basis, using the most relevant data points. For AmpliPhi Biosciences, its most recent trailing-twelve-month earnings is -US$12.73M, which compared to the previous year’s level, has become less negative. Given that these values may be relatively short-term thinking, I have computed an annualized five-year figure for AmpliPhi Biosciences’s net income, which stands at -US$18.02M. This suggests that, while net income is negative, it has become less negative over the years.
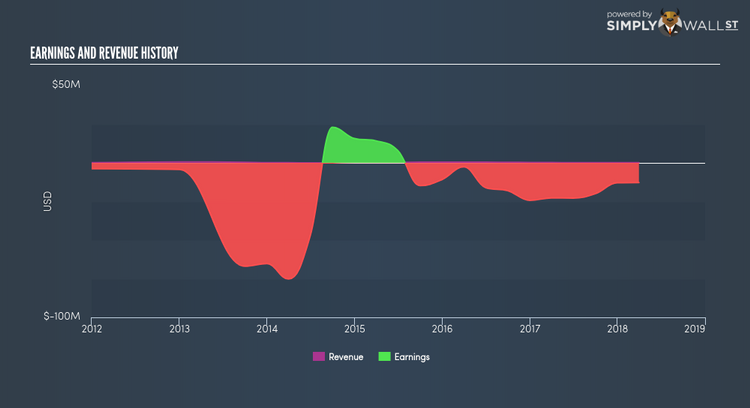
We can further examine AmpliPhi Biosciences’s loss by looking at what the industry has been experiencing over the past few years. Each year, for the past half a decade AmpliPhi Biosciences has seen an annual decline in revenue of -5.62%, on average. This adverse movement is a driver of the company’s inability to reach breakeven. Has the entire industry experienced this headwind? Looking at growth from a sector-level, the US biotechs industry has been growing its average earnings by double-digit 21.75% over the past year, and 18.34% over the previous five years. This means that, despite the fact that AmpliPhi Biosciences is presently running a loss, it may have benefited from industry tailwinds, moving earnings into a more favorable position.
What does this mean?
While past data is useful, it doesn’t tell the whole story. Companies that incur net loss is always difficult to predict what will occur going forward, and when. The most useful step is to examine company-specific issues AmpliPhi Biosciences may be facing and whether management guidance has consistently been met in the past. You should continue to research AmpliPhi Biosciences to get a more holistic view of the stock by looking at:
Future Outlook: What are well-informed industry analysts predicting for APHB’s future growth? Take a look at our free research report of analyst consensus for APHB’s outlook.
Financial Health: Is APHB’s operations financially sustainable? Balance sheets can be hard to analyze, which is why we’ve done it for you. Check out our financial health checks here.
Other High-Performing Stocks: Are there other stocks that provide better prospects with proven track records? Explore our free list of these great stocks here.
NB: Figures in this article are calculated using data from the trailing twelve months from 31 March 2018. This may not be consistent with full year annual report figures.
To help readers see pass the short term volatility of the financial market, we aim to bring you a long-term focused research analysis purely driven by fundamental data. Note that our analysis does not factor in the latest price sensitive company announcements.
The author is an independent contributor and at the time of publication had no position in the stocks mentioned.
