
 Yahoo Finance
 Delfi (SGX:P34) Is Due To Pay A Dividend Of $0.0302
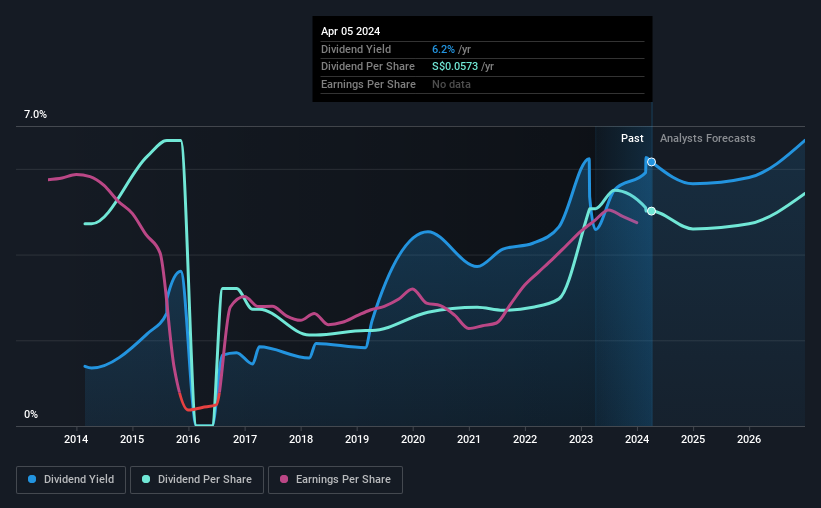
The board of Delfi Limited (SGX:P34) has announced that it will pay a dividend on the 15th of May, with investors receiving $0.0302 per share. However, the dividend yield of 6.2% still remains in a typical range for the industry.
See our latest analysis for Delfi
Delfi's Payment Has Solid Earnings Coverage
Solid dividend yields are great, but they only really help us if the payment is sustainable. Prior to this announcement, Delfi's dividend was only 50% of earnings, however it was paying out 13,811% of free cash flows. While the company may be more focused on returning cash to shareholders than growing the business at this time, we think that a cash payout ratio this high might expose the dividend to being cut if the business ran into some challenges.
Over the next year, EPS is forecast to expand by 11.0%. Assuming the dividend continues along recent trends, we think the payout ratio could be 68% by next year, which is in a pretty sustainable range.
Dividend Volatility
The company's dividend history has been marked by instability, with at least one cut in the last 10 years. Since 2014, the dividend has gone from $0.04 total annually to $0.0425. Dividend payments have grown at less than 1% a year over this period. We're glad to see the dividend has risen, but with a limited rate of growth and fluctuations in the payments the total shareholder return may be limited.
The Dividend Looks Likely To Grow
Given that the dividend has been cut in the past, we need to check if earnings are growing and if that might lead to stronger dividends in the future. Delfi has seen EPS rising for the last five years, at 17% per annum. While on an earnings basis, this company looks appealing as an income stock, the cash payout ratio still makes us cautious.
Our Thoughts On Delfi's Dividend
Overall, the dividend looks like it may have been a bit high, which explains why it has now been cut. While the low payout ratio is a redeeming feature, this is offset by the minimal cash to cover the payments. We would be a touch cautious of relying on this stock primarily for the dividend income.
Market movements attest to how highly valued a consistent dividend policy is compared to one which is more unpredictable. Still, investors need to consider a host of other factors, apart from dividend payments, when analysing a company. Just as an example, we've come across 2 warning signs for Delfi you should be aware of, and 1 of them doesn't sit too well with us. Is Delfi not quite the opportunity you were looking for? Why not check out our selection of top dividend stocks.
Have feedback on this article? Concerned about the content? Get in touch with us directly. Alternatively, email editorial-team (at) simplywallst.com.
This article by Simply Wall St is general in nature. We provide commentary based on historical data and analyst forecasts only using an unbiased methodology and our articles are not intended to be financial advice. It does not constitute a recommendation to buy or sell any stock, and does not take account of your objectives, or your financial situation. We aim to bring you long-term focused analysis driven by fundamental data. Note that our analysis may not factor in the latest price-sensitive company announcements or qualitative material. Simply Wall St has no position in any stocks mentioned.
