
 Yahoo Finance
 Declining Stock and Solid Fundamentals: Is The Market Wrong About Cadence Design Systems, Inc. (NASDAQ:CDNS)?
It is hard to get excited after looking at Cadence Design Systems' (NASDAQ:CDNS) recent performance, when its stock has declined 12% over the past month. However, stock prices are usually driven by a company’s financial performance over the long term, which in this case looks quite promising. In this article, we decided to focus on Cadence Design Systems' ROE.
ROE or return on equity is a useful tool to assess how effectively a company can generate returns on the investment it received from its shareholders. In simpler terms, it measures the profitability of a company in relation to shareholder's equity.
View our latest analysis for Cadence Design Systems
How Do You Calculate Return On Equity?
The formula for return on equity is:
Return on Equity = Net Profit (from continuing operations) ÷ Shareholders' Equity
So, based on the above formula, the ROE for Cadence Design Systems is:
31% = US$1.0b ÷ US$3.4b (Based on the trailing twelve months to December 2023).
The 'return' is the profit over the last twelve months. One way to conceptualize this is that for each $1 of shareholders' capital it has, the company made $0.31 in profit.
What Has ROE Got To Do With Earnings Growth?
We have already established that ROE serves as an efficient profit-generating gauge for a company's future earnings. We now need to evaluate how much profit the company reinvests or "retains" for future growth which then gives us an idea about the growth potential of the company. Assuming everything else remains unchanged, the higher the ROE and profit retention, the higher the growth rate of a company compared to companies that don't necessarily bear these characteristics.
A Side By Side comparison of Cadence Design Systems' Earnings Growth And 31% ROE
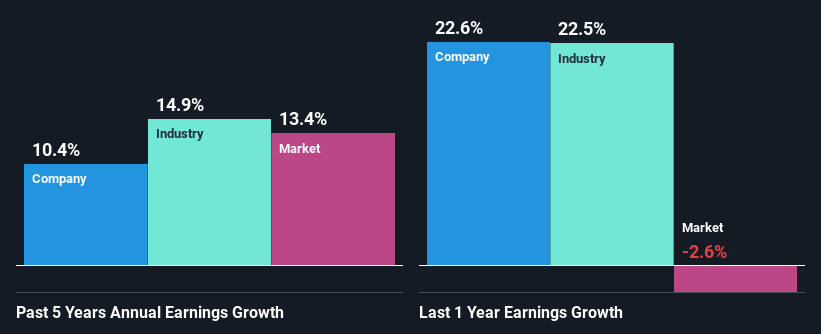
First thing first, we like that Cadence Design Systems has an impressive ROE. Second, a comparison with the average ROE reported by the industry of 13% also doesn't go unnoticed by us. Probably as a result of this, Cadence Design Systems was able to see a decent net income growth of 10% over the last five years.
As a next step, we compared Cadence Design Systems' net income growth with the industry and were disappointed to see that the company's growth is lower than the industry average growth of 15% in the same period.
The basis for attaching value to a company is, to a great extent, tied to its earnings growth. It’s important for an investor to know whether the market has priced in the company's expected earnings growth (or decline). Doing so will help them establish if the stock's future looks promising or ominous. If you're wondering about Cadence Design Systems''s valuation, check out this gauge of its price-to-earnings ratio, as compared to its industry.
Is Cadence Design Systems Using Its Retained Earnings Effectively?
Given that Cadence Design Systems doesn't pay any regular dividends to its shareholders, we infer that the company has been reinvesting all of its profits to grow its business.
Conclusion
Overall, we are quite pleased with Cadence Design Systems' performance. Particularly, we like that the company is reinvesting heavily into its business, and at a high rate of return. As a result, the decent growth in its earnings is not surprising. Having said that, looking at the current analyst estimates, we found that the company's earnings are expected to gain momentum. To know more about the latest analysts predictions for the company, check out this visualization of analyst forecasts for the company.
Have feedback on this article? Concerned about the content? Get in touch with us directly. Alternatively, email editorial-team (at) simplywallst.com.
This article by Simply Wall St is general in nature. We provide commentary based on historical data and analyst forecasts only using an unbiased methodology and our articles are not intended to be financial advice. It does not constitute a recommendation to buy or sell any stock, and does not take account of your objectives, or your financial situation. We aim to bring you long-term focused analysis driven by fundamental data. Note that our analysis may not factor in the latest price-sensitive company announcements or qualitative material. Simply Wall St has no position in any stocks mentioned.
