
 Yahoo Finance
 Are CSE Global Limited's (SGX:544) Mixed Financials The Reason For Its Gloomy Performance on The Stock Market?
CSE Global (SGX:544) has had a rough week with its share price down 4.5%. It is possible that the markets have ignored the company's differing financials and decided to lean-in to the negative sentiment. Stock prices are usually driven by a company’s financial performance over the long term, and therefore we decided to pay more attention to the company's financial performance. In this article, we decided to focus on CSE Global's ROE.
Return on equity or ROE is a key measure used to assess how efficiently a company's management is utilizing the company's capital. In simpler terms, it measures the profitability of a company in relation to shareholder's equity.
Check out our latest analysis for CSE Global
How Is ROE Calculated?
The formula for ROE is:
Return on Equity = Net Profit (from continuing operations) ÷ Shareholders' Equity
So, based on the above formula, the ROE for CSE Global is:
10% = S$22m ÷ S$216m (Based on the trailing twelve months to December 2023).
The 'return' is the profit over the last twelve months. Another way to think of that is that for every SGD1 worth of equity, the company was able to earn SGD0.10 in profit.
What Is The Relationship Between ROE And Earnings Growth?
So far, we've learned that ROE is a measure of a company's profitability. Depending on how much of these profits the company reinvests or "retains", and how effectively it does so, we are then able to assess a company’s earnings growth potential. Assuming everything else remains unchanged, the higher the ROE and profit retention, the higher the growth rate of a company compared to companies that don't necessarily bear these characteristics.
CSE Global's Earnings Growth And 10% ROE
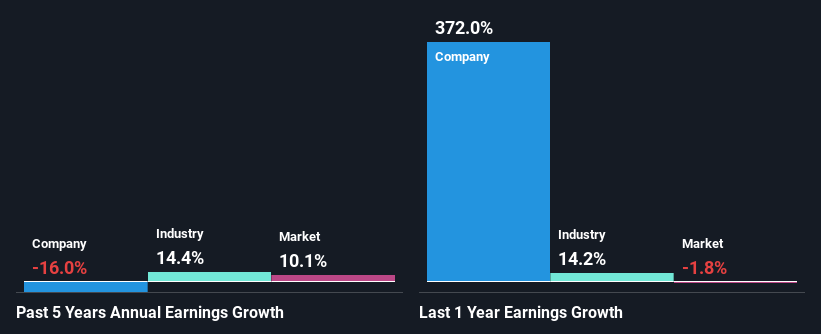
To start with, CSE Global's ROE looks acceptable. And on comparing with the industry, we found that the the average industry ROE is similar at 12%. For this reason, CSE Global's five year net income decline of 16% raises the question as to why the decent ROE didn't translate into growth. Based on this, we feel that there might be other reasons which haven't been discussed so far in this article that could be hampering the company's growth. For example, it could be that the company has a high payout ratio or the business has allocated capital poorly, for instance.
So, as a next step, we compared CSE Global's performance against the industry and were disappointed to discover that while the company has been shrinking its earnings, the industry has been growing its earnings at a rate of 14% over the last few years.
Earnings growth is an important metric to consider when valuing a stock. It’s important for an investor to know whether the market has priced in the company's expected earnings growth (or decline). This then helps them determine if the stock is placed for a bright or bleak future. If you're wondering about CSE Global's's valuation, check out this gauge of its price-to-earnings ratio, as compared to its industry.
Is CSE Global Making Efficient Use Of Its Profits?
CSE Global has a high three-year median payout ratio of 98% (that is, it is retaining 2.3% of its profits). This suggests that the company is paying most of its profits as dividends to its shareholders. This goes some way in explaining why its earnings have been shrinking. With only a little being reinvested into the business, earnings growth would obviously be low or non-existent. You can see the 2 risks we have identified for CSE Global by visiting our risks dashboard for free on our platform here.
Additionally, CSE Global has paid dividends over a period of at least ten years, which means that the company's management is determined to pay dividends even if it means little to no earnings growth. Existing analyst estimates suggest that the company's future payout ratio is expected to drop to 46% over the next three years. Accordingly, the expected drop in the payout ratio explains the expected increase in the company's ROE to 13%, over the same period.
Summary
On the whole, we feel that the performance shown by CSE Global can be open to many interpretations. In spite of the high ROE, the company has failed to see growth in its earnings due to it paying out most of its profits as dividend, with almost nothing left to invest into its own business. Having said that, looking at current analyst estimates, we found that the company's earnings growth rate is expected to see a huge improvement. To know more about the latest analysts predictions for the company, check out this visualization of analyst forecasts for the company.
Have feedback on this article? Concerned about the content? Get in touch with us directly. Alternatively, email editorial-team (at) simplywallst.com.
This article by Simply Wall St is general in nature. We provide commentary based on historical data and analyst forecasts only using an unbiased methodology and our articles are not intended to be financial advice. It does not constitute a recommendation to buy or sell any stock, and does not take account of your objectives, or your financial situation. We aim to bring you long-term focused analysis driven by fundamental data. Note that our analysis may not factor in the latest price-sensitive company announcements or qualitative material. Simply Wall St has no position in any stocks mentioned.
