
 Yahoo Finance
 Crude Oil Weakness Seen Ahead, SPX 500 Recovery Loses Steam
DailyFX.com -
Talking Points:
US Dollar Advance Stalls After Prices Probe Monthly High
S&P 500 Rebound Loses Steam on Test of Former Support
Gold Tests Four-Month Low, Crude Oil at Risk of Weakness
Can’t access the Dow Jones FXCM US Dollar Index? Try the USD basket on Mirror Trader. **
US DOLLAR TECHNICAL ANALYSIS – Prices stalled after advancing to a monthly high having reversed upward as expected. A daily close above the 50% Fibonacci expansion at 11937 exposes the 61.8% level at 11985. Alternatively, a turn below the 38.2% Fib at 11888 clears the way for a test of the 23.6% expansion at 11829.

** The Dow Jones FXCM US Dollar Index and the Mirror Trader USD basket are not the same product.
S&P 500 TECHNICAL ANALYSIS – A shallow correction following an expected downturn has stalled at former support now recast as resistance. From here, a push below the 23.6% Fibonacci retracement at 2072.70 exposes the 14.6% level at 2066.00. Alternatively, a push above the 38.2% Fib at 2083.60 targets 2092.40 (channel floor, 50% retracement).

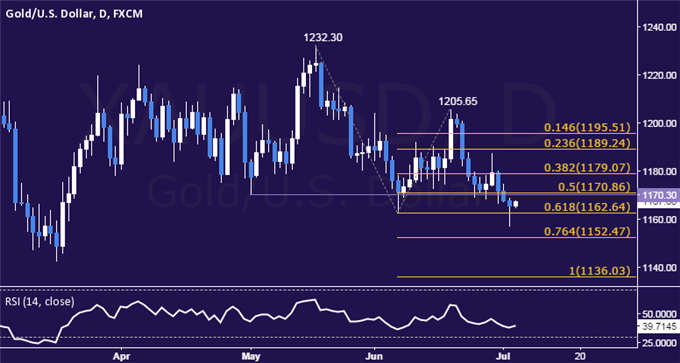
GOLD TECHNICAL ANALYSIS – Prices edged through range support, ending a period of consolidation and seemingly opening the door for deeper losses ahead. A move below the 61.8% Fibonacci expansion at 1162.64 exposes the 76.4% level at 1152.47. Alternatively, a move above the 50% Fib at 1170.86 targets the 38.2% expansion at 1179.07.
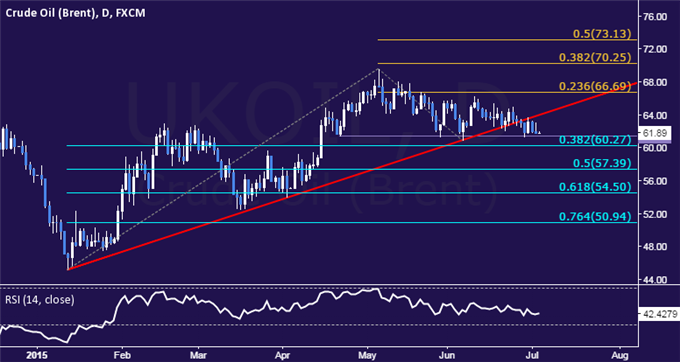
CRUDE OIL TECHNICAL ANALYSIS – Prices cleared rising trend line set from mid-January, hinting the down trend from the second half of 2014 may be resuming. A move below the 60.27-61.37 area (38.2% Fibonacci retracement, April 22 low) exposes the 50% level at 57.39. Alternatively, a turn back above the trend line – now at 63.84 – targets the 23.6% Fib expansion at 66.69.
--- Written by Ilya Spivak, Currency Strategist for DailyFX.com
To receive Ilya's analysis directly via email, please SIGN UP HERE
Contact and follow Ilya on Twitter: @IlyaSpivak
DailyFX provides forex news and technical analysis on the trends that influence the global currency markets.
Learn forex trading with a free practice account and trading charts from FXCM.
