
 Yahoo Finance
 Crude Oil Prices Bounce on OPEC Optimism
DailyFX.com -
Talking Points:
Crude Oil Prices Bounce On OPEC Optimism
Prices Remain Supported Above $44.72
Looking for additional trade ideas for Crude Oil and Commodities? Read our Price Forecast HERE
Crude Oil prices are rebounding, after initially opening lower to start this week’s trading. Traders are bidding Crude in anticipation of an OPEC agreement on production cuts later in the week. While this bounce in Crude Oil is seen as optimistic, it is always possible that a deal may not be reached during Wednesday’s meeting. This may leave Crude Oil prices exposed to larger than normal spikes in volatility, as traders attempt to ascertain the outcome of this event.
Crude Oil Price Daily Chart with Moving Average
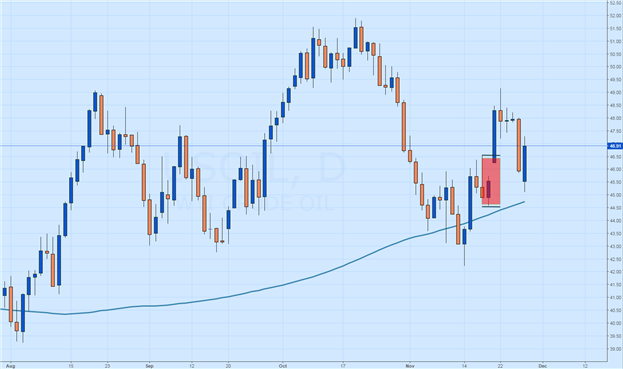
(Created Using TradingView Charts)
Technically, Crude Oil is again bouncing above its 200 day MVA (Simple Moving Average). This average is now found at $44.72, and should continue to monitor as a point of support. If Crude Oil prices continue to bounce, traders may look for the commodity to press towards new monthly highs above the standing November peak of $49.17.
However in the event that no agreement is reached during Wednesday’s meeting, Crude Oil may again start to trade immediately lower. In this bearish scenario, traders should first look for prices to breach today’s low of $45.12. This movement would then be followed by prices making an attempt below the previously mentioned moving average. While a move below $44.72 is anything but certain, a daily close beyond this point could spell the end of a stagnating 2016 bull trend.
Crude Oil Price 30 Minute Chart with Pivots
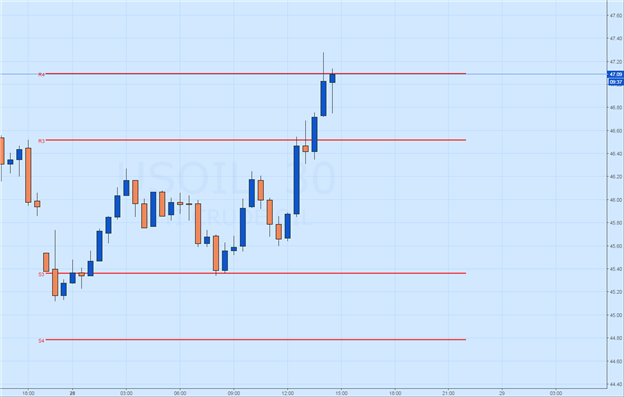
(Created Using TradingView Charts)
Intraday analysis shows Crude Oil prices testing key resistance near $47.11. This area is represented graphically above as today’s R4 pivot, and a move through this point may suggest the beginning of a short term bullish breakout. In the event of a reversal, traders should look for Crude Oil prices to trade back below $46.52. A move to this point would suggest at least a temporary end of this morning’s bullish run in price, and open the commodity to trade back towards intraday values of support. This includes the S3 pivot at $45.36, and the S4 pivot at $44.77.
--- Written by Walker, Analyst for DailyFX.com
To Receive Walkers’ analysis directly via email, please SIGN UP HERE
See Walker’s most recent articles at hisBio Page
.
Contact and Follow Walker on Twitter @WEnglandFX.
DailyFX provides forex news and technical analysis on the trends that influence the global currency markets.
Learn forex trading with a free practice account and trading charts from IG.
