
 Yahoo Finance
 Crude Oil Price Update – Big Decision Coming from Bullish Traders on Test of $50.60 to $50.01
December West Texas Intermediate Crude Oil futures finished higher on Friday, basically saving the market from posting a lower close for the week.
The price action suggests that investors are waiting for clarity over whether OPEC and the major non-OPEC producers will extend their strategy to cut output in an effort to decrease the global supply glut and stabilize prices.
I expect to see a rangebound trade until the decision is made to extend or perhaps even deepen the production cuts.
Daily Swing Chart Analysis
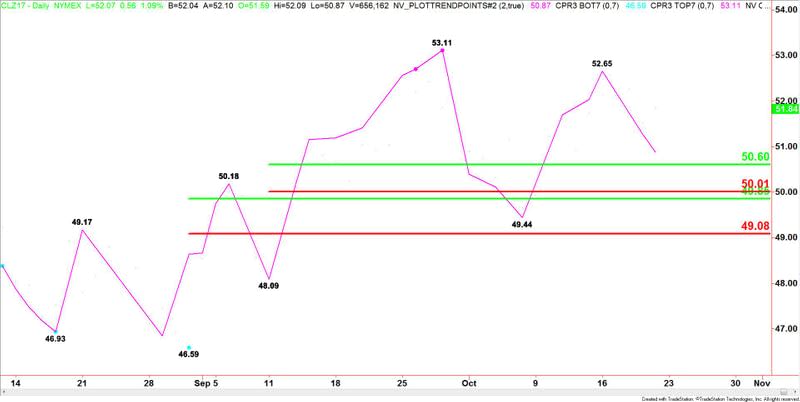
The main trend is up according to the daily swing chart, however, last week’s secondary lower top suggests the selling may be greater than the buying at current price levels. The price action also suggests that momentum is shifting to the downside.
A trade through $52.65 will signal a resumption of the uptrend. However, the trigger point for an acceleration to the upside is $53.11.
The main trend will turn to down on a move through $49.44. This is followed by main bottoms at $48.09 and $46.59.
The main range is $46.59 to $53.11. Its retracement zone is $49.85 to $49.08. This zone is the primary downside target. It also provided support on October 6 when the market reached a bottom at $49.44.
The next range is $48.09 to $53.11. Its retracement zone is $50.60 to $50.01. This zone is the next downside target. Since the main trend is up, buyers may come in on a test of this zone.
Combining the two retracement zones creates a support cluster at $50.01 to $49.85. I think this zone will be most important next week. If it fails to hold then enough selling may come in to drive the crude oil market through $49.44 and change the main trend to down.
Next week, bullish traders are going to have a decision to make on a pullback into $50.60 to $49.85. The market must continue to produce, at a minimum, higher bottoms, or the trend will change to down.
This article was originally posted on FX Empire
More From FXEMPIRE:
Dow Jones 30 and NASDAQ 100 forecast for the week of October 23, 2017, Technical Analysis
S&P 500 Price forecast for the week of October 23, 2017, Technical Analysis
Gold Price Futures (GC) Technical Analysis – Trading on Bearish Side of Major 50% Level at $1286.80
U.S. Stock Indexes Surge After Senate Moves Toward Tax Reform
Natural Gas Price forecast for the week of October 23, 2017, Technical Analysis
