
 Yahoo Finance
 Crude Oil Eyeing 63.00 Figure, SPX 500 Digesting Drive to Record High
DailyFX.com -
Talking Points:
US Dollar Threatening Familiar Range Top Yet Again
S&P 500 Continues to Consolidate Near Record High
Gold Trying to Break Down Trend, Crude Oil Eyes $63
Can’t access the Dow Jones FXCM US Dollar Index? Try the USD basket on Mirror Trader. **
US DOLLAR TECHNICAL ANALYSIS – Prices continue to tread water having topped as expected after putting in a bearish Evening Star candlestick pattern. A daily close below the 14.6% Fibonacci retracementat 11740 exposes the 23.6% level at 11653. Alternatively, a turn above the 11854-76 zone (14.6% Fib expansion, March 2009 high) clears the way for a test of the 23.6% expansion at 11963.

Daily Chart - Created Using FXCM Marketscope
** The Dow Jones FXCM US Dollar Index and the Mirror Trader USD basket are not the same product.
S&P 500 TECHNICAL ANALYSIS – Prices paused to digest gains after advancing to yet another record high. A daily close above the 14.6% Fibonacci expansion at 2121.80 exposes the 23.6% level at 2133.70. Near-term support is at 2102.60, the February 23 low, with a break below that targeting the 23.6% Fib retracement at 2086.40.
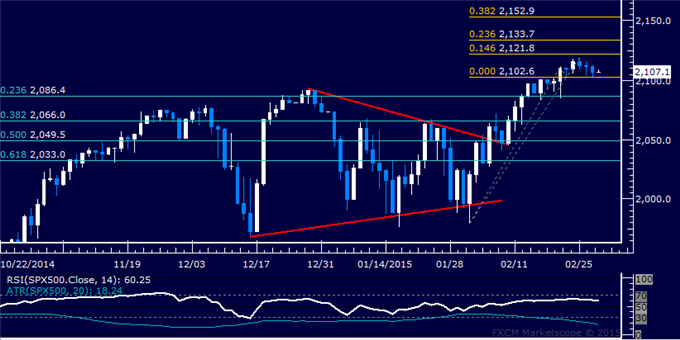
Daily Chart - Created Using FXCM Marketscope
GOLD TECHNICAL ANALYSIS – Prices are attempting to launch a recovery after dropping to the lowest level in two months. A daily close above the intersection of trend line support-turned-resistance and the 23.6% Fibonacci retracement at 1216.30 exposes the 38.2% level at 1233.73. Alternatively, a reversal below the 14.6% Fib at 1205.56 targets the February 23 low at 1188.13.
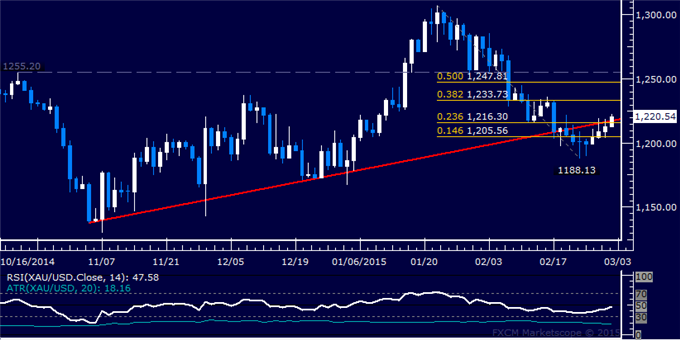
Daily Chart - Created Using FXCM Marketscope
CRUDE OIL TECHNICAL ANALYSIS – Prices launched a recovery as expected, with buyers now attempting to clear February’s swing high. A break above the 61.98-62.98 area (23.6% Fibonacci expansion, February 17 high) exposes the 38.2% level at 64.58. Alternatively, a reversal below the 14.6% Fib at 60.38 targets resistance-turned-support at 58.17.
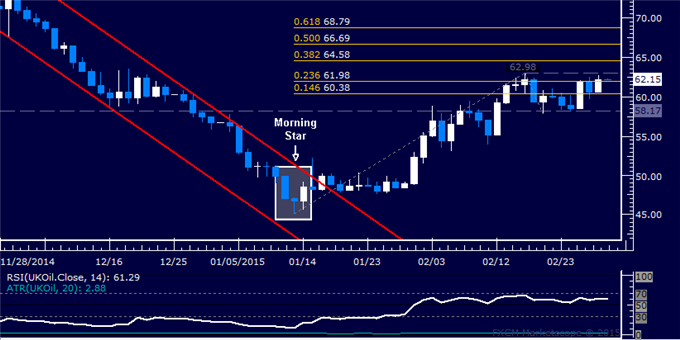
Daily Chart - Created Using FXCM Marketscope
--- Written by Ilya Spivak, Currency Strategist for DailyFX.com
To receive Ilya's analysis directly via email, please SIGN UP HERE
Contact and follow Ilya on Twitter: @IlyaSpivak
DailyFX provides forex news and technical analysis on the trends that influence the global currency markets.
Learn forex trading with a free practice account and trading charts from FXCM.
