
 Yahoo Finance
 Crude Oil Drops Most in Two Weeks, SPX 500 Marking Time
DailyFX.com -
Talking Points:
US Dollar Stalls at Former Support After Corrective Recovery
S&P 500 Continues to Tread Water Below Familiar Range Top
Gold May Be Topping, Crude Oil Declines Most in Two Weeks
Can’t access the Dow Jones FXCM US Dollar Index? Try the USD basket on Mirror Trader. **
US DOLLAR TECHNICAL ANALYSIS – Prices stalled on a retest of a pivotal trend line after correcting upward from a monthly low. Near-term resistance is in the 12027-49 area (23.6% Fibonacci expansion, trend line), with a break above that on a daily closing basis exposing the 38.2% level at 12089. Alternatively, a turn below the 14.6% expansion at 11989 clears the way for a test of the 50% Fib retracement at 11950.
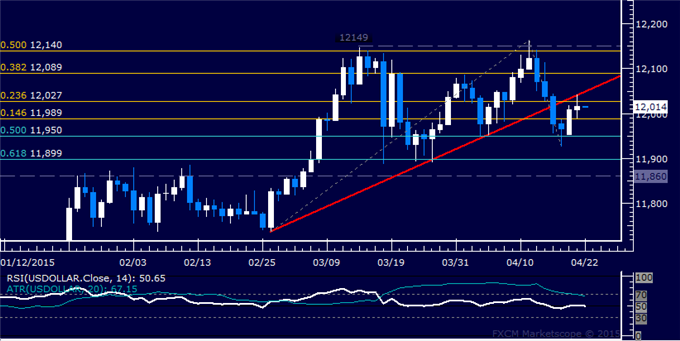
Daily Chart - Created Using FXCM Marketscope
** The Dow Jones FXCM US Dollar Index and the Mirror Trader USD basket are not the same product.
S&P 500 TECHNICAL ANALYSIS – Prices continue to hover below resistance in the 2111.00-19.40 area (23.6% Fibonacci expansion, February 25 high). A break above that on a daily closing basis exposing the 38.2% level at 2154.90. Alternatively, a reversal below the 14.6% Fib at 2084.00 targets the March 12 low at 2040.10.
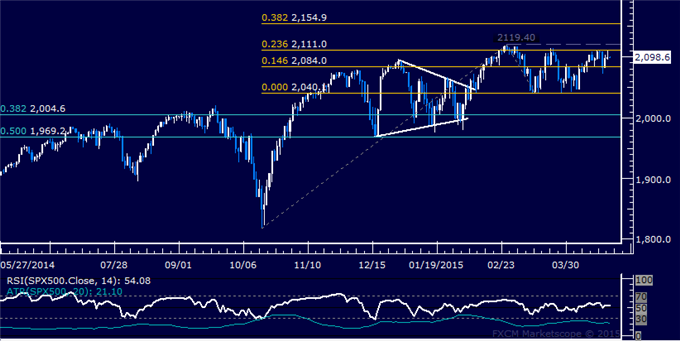
Daily Chart - Created Using FXCM Marketscope
GOLD TECHNICAL ANALYSIS – Prices may be carving out a bearish Head and Shoulders top chart pattern. Confirmation is required on a daily close below 1185.23, the 23.6% Fibonacci expansion, with the first downside target thereafter coming in the 38.2% level (1161.16). Near-term resistance is at 1224.15, the April 6 high.

Daily Chart - Created Using FXCM Marketscope
CRUDE OIL TECHNICAL ANALYSIS – Prices turned lower anew having found resistance below the $65/barrel figure. Near-term support is at 60.25, the 23.6% Fibonacci retracement, with a break below that on a daily closing basis exposing the 38.2% level at 57.37. Alternatively, a move back above the 14.6% Fib at 62.03 targets the April 16 high at 64.91.
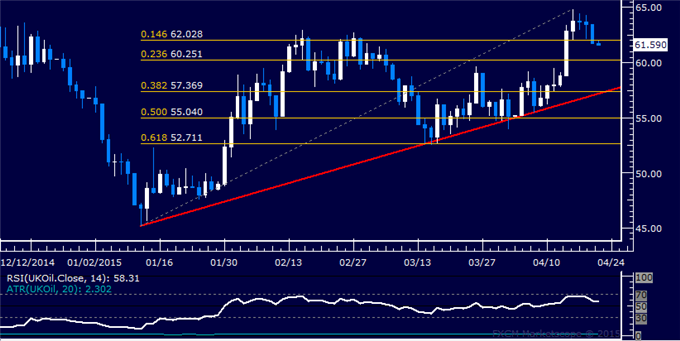
Daily Chart - Created Using FXCM Marketscope
--- Written by Ilya Spivak, Currency Strategist for DailyFX.com
To receive Ilya's analysis directly via email, please SIGN UP HERE
Contact and follow Ilya on Twitter: @IlyaSpivak
DailyFX provides forex news and technical analysis on the trends that influence the global currency markets.
Learn forex trading with a free practice account and trading charts from FXCM.
