
 Yahoo Finance
 Crude Oil Aims to Extend Gains After Hitting 4-Month High
DailyFX.com -
Talking Points:
US Dollar Vulnerable to Deeper Losses After Support Break
S&P 500 Continues to Tread Water at Familiar Range Top
Crude Oil Aims to Extend Gains After Hitting 4-Month High
Can’t access the Dow Jones FXCM US Dollar Index? Try the USD basket on Mirror Trader. **
US DOLLAR TECHNICAL ANALYSIS – Prices snapped support at a trend line guiding prices higher since late February, hinting a near-term trend reversal may be at hand. A daily close below the 50% Fibonacci retracement at 11950 exposes the 61.8% level at 11899. Alternatively, a reversal above the 38.2% Fib at 12000 opens the door for a challenge of trend line support-turned-resistance at 12025.

Daily Chart - Created Using FXCM Marketscope
** The Dow Jones FXCM US Dollar Index and the Mirror Trader USD basket are not the same product.
S&P 500 TECHNICAL ANALYSIS – Prices continue to test resistance in the 2111.00-19.40 area (23.6% Fibonacci expansion, February 25 high), with a break above that on a daily closing basis exposing the 38.2% level at 2154.90. Alternatively, a reversal below the 14.6% Fib at 2084.00 targets the March 12 low at 2040.10.
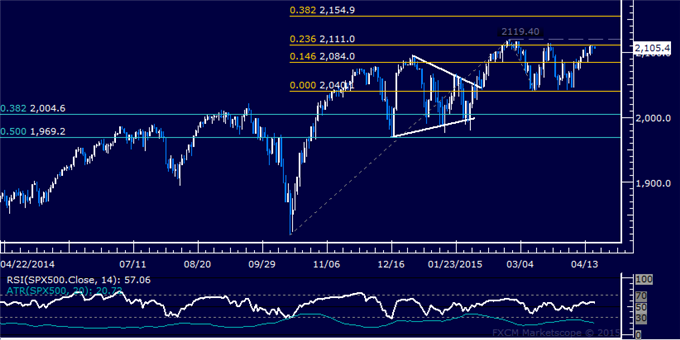
Daily Chart - Created Using FXCM Marketscope
GOLD TECHNICAL ANALYSIS – Prices have stalled above support at 1185.23, the 23.6% Fibonacci expansion. A break below this barrier exposes the 38.2% level at 1161.16. Near-term resistance is at 1224.15, the April 6 high.
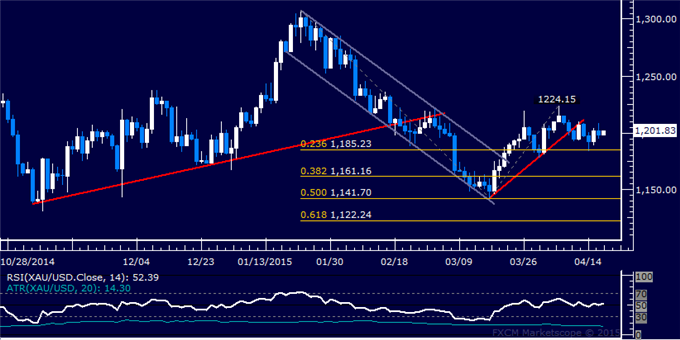
Daily Chart - Created Using FXCM Marketscope
CRUDE OIL TECHNICAL ANALYSIS – Prices look poised to continue higher after clearing resistance in the 62.98-63.56 area (February 17 high, 61.8% Fibonacci expansion). From here, a break above the 76.4% level at 66.16 exposes the 100% level at 70.36. Alternatively, a reversal back below 62.98 targets the 50% Fib at 61.45.
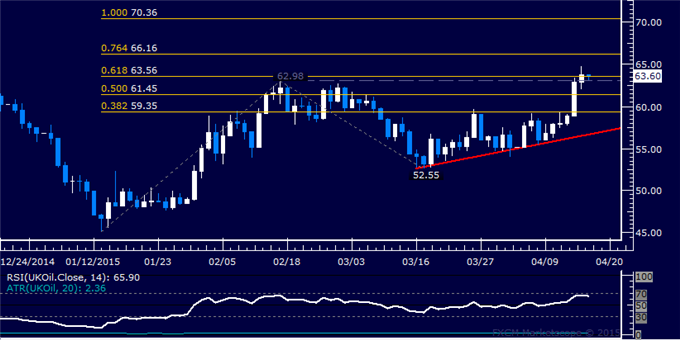
Daily Chart - Created Using FXCM Marketscope
--- Written by Ilya Spivak, Currency Strategist for DailyFX.com
To receive Ilya's analysis directly via email, please SIGN UP HERE
Contact and follow Ilya on Twitter: @IlyaSpivak
DailyFX provides forex news and technical analysis on the trends that influence the global currency markets.
Learn forex trading with a free practice account and trading charts from FXCM.
