
 Yahoo Finance
 Coupang (NYSE:CPNG) Shareholders Will Want The ROCE Trajectory To Continue
If we want to find a potential multi-bagger, often there are underlying trends that can provide clues. Amongst other things, we'll want to see two things; firstly, a growing return on capital employed (ROCE) and secondly, an expansion in the company's amount of capital employed. Basically this means that a company has profitable initiatives that it can continue to reinvest in, which is a trait of a compounding machine. So on that note, Coupang (NYSE:CPNG) looks quite promising in regards to its trends of return on capital.
Return On Capital Employed (ROCE): What Is It?
For those who don't know, ROCE is a measure of a company's yearly pre-tax profit (its return), relative to the capital employed in the business. To calculate this metric for Coupang, this is the formula:
Return on Capital Employed = Earnings Before Interest and Tax (EBIT) ÷ (Total Assets - Current Liabilities)
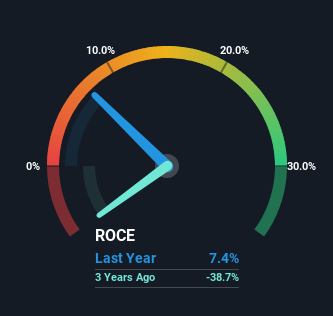
0.074 = US$473m ÷ (US$13b - US$6.9b) (Based on the trailing twelve months to December 2023).
So, Coupang has an ROCE of 7.4%. Ultimately, that's a low return and it under-performs the Multiline Retail industry average of 11%.
View our latest analysis for Coupang
Above you can see how the current ROCE for Coupang compares to its prior returns on capital, but there's only so much you can tell from the past. If you'd like to see what analysts are forecasting going forward, you should check out our free analyst report for Coupang .
How Are Returns Trending?
Coupang has recently broken into profitability so their prior investments seem to be paying off. Shareholders would no doubt be pleased with this because the business was loss-making five years ago but is is now generating 7.4% on its capital. In addition to that, Coupang is employing 5,684% more capital than previously which is expected of a company that's trying to break into profitability. We like this trend, because it tells us the company has profitable reinvestment opportunities available to it, and if it continues going forward that can lead to a multi-bagger performance.
One more thing to note, Coupang has decreased current liabilities to 52% of total assets over this period, which effectively reduces the amount of funding from suppliers or short-term creditors. So this improvement in ROCE has come from the business' underlying economics, which is great to see. Nevertheless, there are some potential risks the company is bearing with current liabilities that high, so just keep that in mind.
Our Take On Coupang's ROCE
Overall, Coupang gets a big tick from us thanks in most part to the fact that it is now profitable and is reinvesting in its business. And since the stock has fallen 60% over the last three years, there might be an opportunity here. With that in mind, we believe the promising trends warrant this stock for further investigation.
One more thing, we've spotted 1 warning sign facing Coupang that you might find interesting.
If you want to search for solid companies with great earnings, check out this free list of companies with good balance sheets and impressive returns on equity.
Have feedback on this article? Concerned about the content? Get in touch with us directly. Alternatively, email editorial-team (at) simplywallst.com.
This article by Simply Wall St is general in nature. We provide commentary based on historical data and analyst forecasts only using an unbiased methodology and our articles are not intended to be financial advice. It does not constitute a recommendation to buy or sell any stock, and does not take account of your objectives, or your financial situation. We aim to bring you long-term focused analysis driven by fundamental data. Note that our analysis may not factor in the latest price-sensitive company announcements or qualitative material. Simply Wall St has no position in any stocks mentioned.