
 Yahoo Finance
 Has Computacenter plc (LON:CCC) Got Enough Cash?

Small-cap and large-cap companies receive a lot of attention from investors, but mid-cap stocks like Computacenter plc (LON:CCC), with a market cap of UK£1.63b, are often out of the spotlight. Surprisingly though, when accounted for risk, mid-caps have delivered better returns compared to the two other categories of stocks. Today we will look at CCC’s financial liquidity and debt levels, which are strong indicators for whether the company can weather economic downturns or fund strategic acquisitions for future growth. Note that this information is centred entirely on financial health and is a top-level understanding, so I encourage you to look further into CCC here. See our latest analysis for Computacenter
How much cash does CCC generate through its operations?
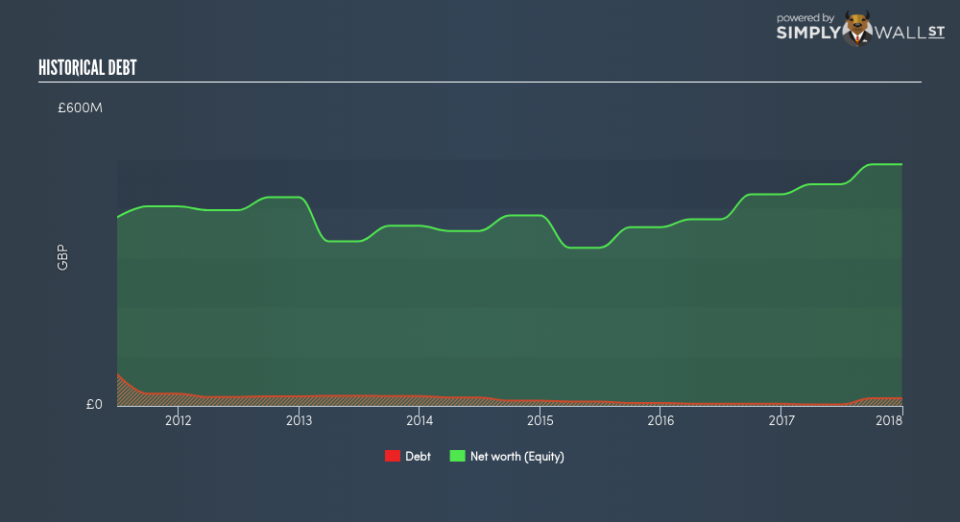
CCC’s debt levels surged from UK£4.18m to UK£15.42m over the last 12 months , which is made up of current and long term debt. With this increase in debt, the current cash and short-term investment levels stands at UK£206.61m , ready to deploy into the business. On top of this, CCC has generated UK£106.11m in operating cash flow over the same time period, resulting in an operating cash to total debt ratio of 688.20%, signalling that CCC’s current level of operating cash is high enough to cover debt. This ratio can also be a sign of operational efficiency as an alternative to return on assets. In CCC’s case, it is able to generate 6.88x cash from its debt capital.
Can CCC meet its short-term obligations with the cash in hand?
With current liabilities at UK£940.91m, it appears that the company has maintained a safe level of current assets to meet its obligations, with the current ratio last standing at 1.36x. Usually, for IT companies, this is a suitable ratio as there’s enough of a cash buffer without holding too capital in low return investments.
Does CCC face the risk of succumbing to its debt-load?
CCC’s level of debt is low relative to its total equity, at 3.15%. This range is considered safe as CCC is not taking on too much debt obligation, which can be restrictive and risky for equity-holders.
Next Steps:
CCC has demonstrated its ability to generate sufficient levels of cash flow, while its debt hovers at a safe level. In addition to this, the company exhibits an ability to meet its near term obligations should an adverse event occur. This is only a rough assessment of financial health, and I’m sure CCC has company-specific issues impacting its capital structure decisions. I suggest you continue to research Computacenter to get a better picture of the stock by looking at:
Future Outlook: What are well-informed industry analysts predicting for CCC’s future growth? Take a look at our free research report of analyst consensus for CCC’s outlook.
Valuation: What is CCC worth today? Is the stock undervalued, even when its growth outlook is factored into its intrinsic value? The intrinsic value infographic in our free research report helps visualize whether CCC is currently mispriced by the market.
Other High-Performing Stocks: Are there other stocks that provide better prospects with proven track records? Explore our free list of these great stocks here.
To help readers see pass the short term volatility of the financial market, we aim to bring you a long-term focused research analysis purely driven by fundamental data. Note that our analysis does not factor in the latest price sensitive company announcements.
The author is an independent contributor and at the time of publication had no position in the stocks mentioned.
