
 Yahoo Finance
 Commodities: Crude Oil, Gold Vulnerable as "Fiscal Cliff" Fears Return
Crude oil and gold appear vulnerable as “fiscal cliff” fears return to undermine risk appetite and reboot demand for the safe-haven US Dollar.
Talking Points
Crude Oil, Copper May Follow Stocks Lower on US “Fiscal Cliff” Fears
Gold and Silver Vulnerable to US Rebound on Returning Haven Demand
Commodities are on the upswing ahead of the opening bell on Wall Street but optimism may prove fleeting as “fiscal cliff” concerns re-enter the spotlight. All eyes are onUS President Obama as he delivers a speech in Detroit to promote his plan to avoid the “fiscal cliff”, a set of spending cuts and tax hikes estimated to tip the world’s top economy into recession in the first half next year if left to trigger as scheduled.
Obama’s plan features $1.6 trillion in tax increases and $600 billion in spending cuts. Republicans and Democrats have been at loggerheads on a compromise plan to avoid the “cliff” and more of the same is likely to weigh on risk appetite. Such an outcome is likely to produce losses for risk-linked crude oil and copper price while gold and silver see de-facto pressure amid returning haven demand for the US Dollar.
WTI Crude Oil (NY Close): $85.93 // -0.33 // -0.38%
Prices moved lower as expected after putting in a Shooting Star candlestick. A bearish continuation Flag chart pattern now appears to be in the works, with a break of support at 85.76 confirming the setup and initially exposing the 38.2% Fibonacci expansion at 84.04. Near-term, resistance is at 89.19. A push above that aims for the Flag top at 90.76.
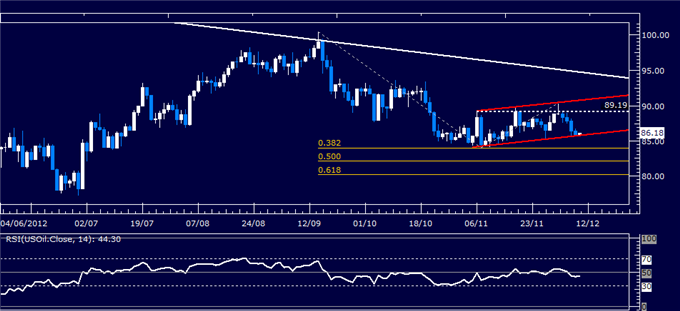
Daily Chart - Created Using FXCM Marketscope 2.0
Spot Gold (NY Close): $1704.05 // +4.15 // +0.24%
Prices broke lower after putting in a Bearish Engulfing candlestick pattern, taking out support at a rising trend line set from late June. Sellers now aim to challenge the November 5 low at 1672.50. The trend line (now at 1711.06) has been recast as resistance, with a push back above that aiming to challenge 1752.55.

Daily Chart - Created Using FXCM Marketscope 2.0
Want to learn more about RSI? Watch this Video
Spot Silver (NY Close): $33.07 // +0.04 // +0.11%
Prices are testing above the 23.6% Fibonacci expansion (33.28), with a break higher exposing channel support-turned-resistance now at the 34.45. Support is at 32.59, the 38.2% Fib. A drop below that aims for the 50% level at 32.03.

Daily Chart - Created Using FXCM Marketscope 2.0
Want to learn more about RSI? Watch this Video
COMEX E-Mini Copper (NY Close): $3.664 // +0.020 // +0.55%
Prices are testing above resistance at 3.676, the 50% Fibonacci expansion, with a break higher exposing the 61.8% level at 3.742. Near-term trend line resistance-turned-support set from the September 14 swing high is at 3.636. A drop below that targets the 38.2% expansion at 3.612.

Daily Chart - Created Using FXCM Marketscope 2.0
--- Written by Ilya Spivak, Currency Strategist for Dailyfx.com
To contact Ilya, e-mail ispivak@dailyfx.com. Follow Ilya on Twitter at @IlyaSpivak
To be added to Ilya's e-mail distribution list, please CLICK HERE
DailyFX provides forex news and technical analysis on the trends that influence the global currency markets.
Learn forex trading with a free practice account and trading charts from FXCM.
