
 Yahoo Finance
 Citizens Financial Group Inc's Dividend Analysis
Exploring the Sustainability and Growth of CFG's Dividends
Citizens Financial Group Inc (NYSE:CFG) recently announced a dividend of $0.42 per share, payable on 2024-05-15, with the ex-dividend date set for 2024-04-30. As investors look forward to this upcoming payment, the spotlight also shines on the company's dividend history, yield, and growth rates. Using the data from GuruFocus, let's look into Citizens Financial Group Inc's dividend performance and assess its sustainability.
What Does Citizens Financial Group Inc Do?
This Powerful Chart Made Peter Lynch 29% A Year For 13 Years
How to calculate the intrinsic value of a stock?
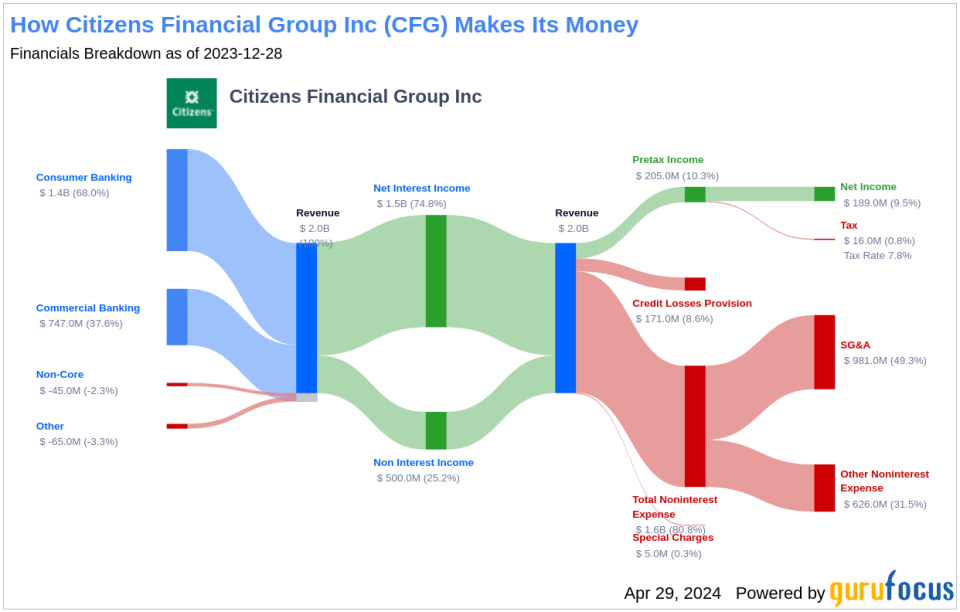
Citizens Financial Group is a bank holding company headquartered in Providence, Rhode Island. Its two primary business segments are consumer banking and commercial banking. Citizens offers a mix of retail and commercial products including capital markets and wealth options. The bank has over 1,100 branches in 14 states, although it is concentrated in the Northeast. It has over $220 billion of total assets. It generates maximum revenue from Consumer Banking Segment.
A Glimpse at Citizens Financial Group Inc's Dividend History
Citizens Financial Group Inc has maintained a consistent dividend payment record since 2014. Dividends are currently distributed on a quarterly basis.
Citizens Financial Group Inc has increased its dividend each year since 2014. The stock is thus listed as a dividend achiever, an honor that is given to companies that have increased their dividend each year for at least the past 10 years. Below is a chart showing annual Dividends Per Share for tracking historical trends.
Breaking Down Citizens Financial Group Inc's Dividend Yield and Growth
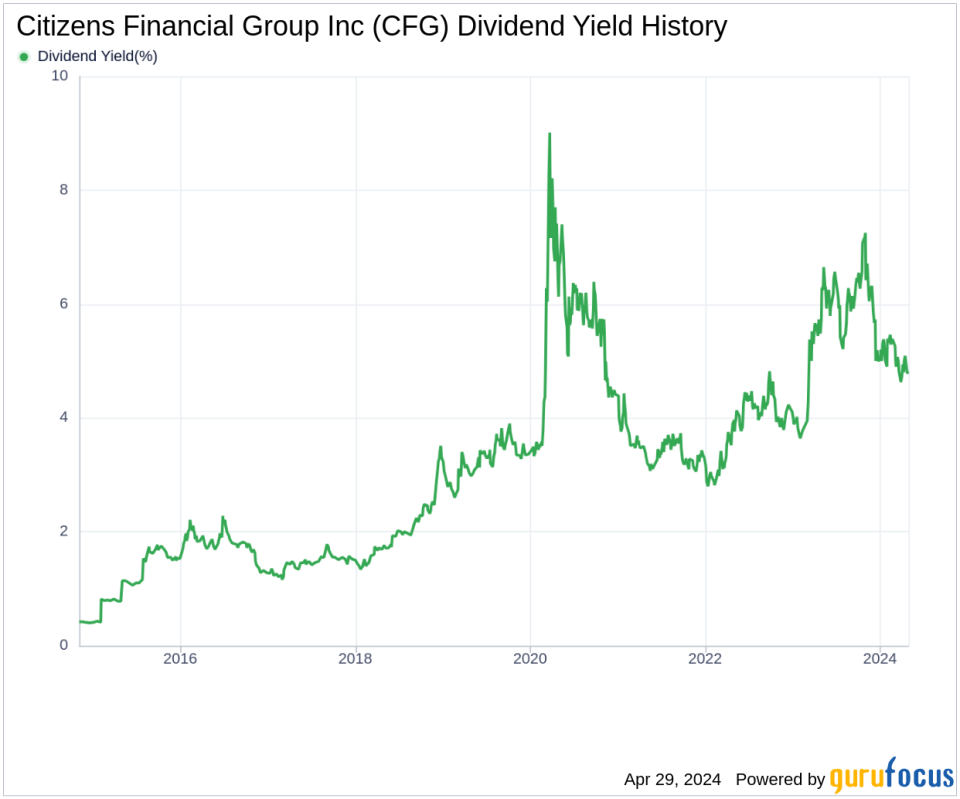
As of today, Citizens Financial Group Inc currently has a 12-month trailing dividend yield of 4.78% and a 12-month forward dividend yield of 4.78%. This suggests an expectation of same dividend payments over the next 12 months.
Over the past three years, Citizens Financial Group Inc's annual dividend growth rate was 2.50%. Extended to a five-year horizon, this rate increased to 9.60% per year. Based on Citizens Financial Group Inc's dividend yield and five-year growth rate, the 5-year yield on cost of Citizens Financial Group Inc stock as of today is approximately 7.56%.
The Sustainability Question: Payout Ratio and Profitability
To assess the sustainability of the dividend, one needs to evaluate the company's payout ratio. The dividend payout ratio provides insights into the portion of earnings the company distributes as dividends. A lower ratio suggests that the company retains a significant part of its earnings, thereby ensuring the availability of funds for future growth and unexpected downturns. As of 2024-03-31, Citizens Financial Group Inc's dividend payout ratio is 0.47.
Citizens Financial Group Inc's profitability rank, offers an understanding of the company's earnings prowess relative to its peers. GuruFocus ranks Citizens Financial Group Inc's profitability 6 out of 10 as of 2024-03-31, suggesting fair profitability. The company has reported positive net income for each of year over the past decade, further solidifying its high profitability.
Growth Metrics: The Future Outlook
To ensure the sustainability of dividends, a company must have robust growth metrics. Citizens Financial Group Inc's growth rank of 6 out of 10 suggests that the company has a fair growth outlook.
Revenue is the lifeblood of any company, and Citizens Financial Group Inc's revenue per share, combined with the 3-year revenue growth rate, indicates a strong revenue model. Citizens Financial Group Inc's revenue has increased by approximately 2.30% per year on average, a rate that underperforms than approximately 71.96% of global competitors.
The company's 3-year EPS growth rate showcases its capability to grow its earnings, a critical component for sustaining dividends in the long run. During the past three years, Citizens Financial Group Inc's earnings increased by approximately 17.20% per year on average, a rate that underperforms than approximately 41.81% of global competitors.
Lastly, the company's 5-year EBITDA growth rate of 5.80%, which underperforms than approximately 55.88% of global competitors.
Next Steps
Considering Citizens Financial Group Inc's consistent dividend payments, increasing dividend growth rate, reasonable payout ratio, fair profitability, and growth metrics, investors can view CFG as a potential candidate for their income-generating portfolios. However, it is also important to keep an eye on the company's growth indicators and profitability to ensure the sustainability of future dividends. As the financial landscape evolves, will Citizens Financial Group Inc maintain its dividend achiever status? Only time will tell.
GuruFocus Premium users can screen for high-dividend yield stocks using the High Dividend Yield Screener.
This article, generated by GuruFocus, is designed to provide general insights and is not tailored financial advice. Our commentary is rooted in historical data and analyst projections, utilizing an impartial methodology, and is not intended to serve as specific investment guidance. It does not formulate a recommendation to purchase or divest any stock and does not consider individual investment objectives or financial circumstances. Our objective is to deliver long-term, fundamental data-driven analysis. Be aware that our analysis might not incorporate the most recent, price-sensitive company announcements or qualitative information. GuruFocus holds no position in the stocks mentioned herein.
This article first appeared on GuruFocus.
