
 Yahoo Finance
 Church & Dwight (NYSE:CHD) Has More To Do To Multiply In Value Going Forward
What trends should we look for it we want to identify stocks that can multiply in value over the long term? Firstly, we'll want to see a proven return on capital employed (ROCE) that is increasing, and secondly, an expanding base of capital employed. Put simply, these types of businesses are compounding machines, meaning they are continually reinvesting their earnings at ever-higher rates of return. That's why when we briefly looked at Church & Dwight's (NYSE:CHD) ROCE trend, we were pretty happy with what we saw.
Understanding Return On Capital Employed (ROCE)
For those that aren't sure what ROCE is, it measures the amount of pre-tax profits a company can generate from the capital employed in its business. To calculate this metric for Church & Dwight, this is the formula:
Return on Capital Employed = Earnings Before Interest and Tax (EBIT) ÷ (Total Assets - Current Liabilities)
0.15 = US$1.1b ÷ (US$8.6b - US$1.4b) (Based on the trailing twelve months to December 2023).
Thus, Church & Dwight has an ROCE of 15%. In isolation, that's a pretty standard return but against the Household Products industry average of 23%, it's not as good.
View our latest analysis for Church & Dwight
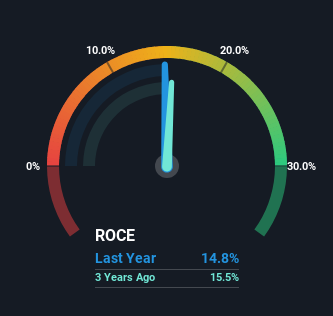
Above you can see how the current ROCE for Church & Dwight compares to its prior returns on capital, but there's only so much you can tell from the past. If you'd like, you can check out the forecasts from the analysts covering Church & Dwight for free.
How Are Returns Trending?
While the current returns on capital are decent, they haven't changed much. The company has consistently earned 15% for the last five years, and the capital employed within the business has risen 51% in that time. Since 15% is a moderate ROCE though, it's good to see a business can continue to reinvest at these decent rates of return. Stable returns in this ballpark can be unexciting, but if they can be maintained over the long run, they often provide nice rewards to shareholders.
The Bottom Line
To sum it up, Church & Dwight has simply been reinvesting capital steadily, at those decent rates of return. And since the stock has risen strongly over the last five years, it appears the market might expect this trend to continue. So even though the stock might be more "expensive" than it was before, we think the strong fundamentals warrant this stock for further research.
One more thing to note, we've identified 1 warning sign with Church & Dwight and understanding it should be part of your investment process.
While Church & Dwight isn't earning the highest return, check out this free list of companies that are earning high returns on equity with solid balance sheets.
Have feedback on this article? Concerned about the content? Get in touch with us directly. Alternatively, email editorial-team (at) simplywallst.com.
This article by Simply Wall St is general in nature. We provide commentary based on historical data and analyst forecasts only using an unbiased methodology and our articles are not intended to be financial advice. It does not constitute a recommendation to buy or sell any stock, and does not take account of your objectives, or your financial situation. We aim to bring you long-term focused analysis driven by fundamental data. Note that our analysis may not factor in the latest price-sensitive company announcements or qualitative material. Simply Wall St has no position in any stocks mentioned.
