
 Yahoo Finance
 China Aviation Oil (Singapore) Corporation Ltd (SGX:G92): Did It Outperform The Industry?

Understanding how China Aviation Oil (Singapore) Corporation Ltd (SGX:G92) is performing as a company requires looking at more than just a years’ earnings. Today I will run you through a basic sense check to gain perspective on how China Aviation Oil (Singapore) is doing by comparing its latest earnings with its long-term trend as well as the performance of its oil and gas industry peers. View our latest analysis for China Aviation Oil (Singapore)
How Well Did G92 Perform?
To account for any quarterly or half-yearly updates, I use data from the most recent 12 months, which annualizes the most recent half-year data, or in some cases, the latest annual report is already the most recent financial year data. This enables me to analyze many different companies on a similar basis, using new information. For China Aviation Oil (Singapore), its most recent trailing-twelve-month earnings is US$88.61M, which compared to the previous year’s figure, Since these figures are fairly short-term thinking, I’ve computed an annualized five-year figure for G92’s net income, which stands at US$68.73M This means on average, China Aviation Oil (Singapore) has been able to improve its earnings over the past couple of years.
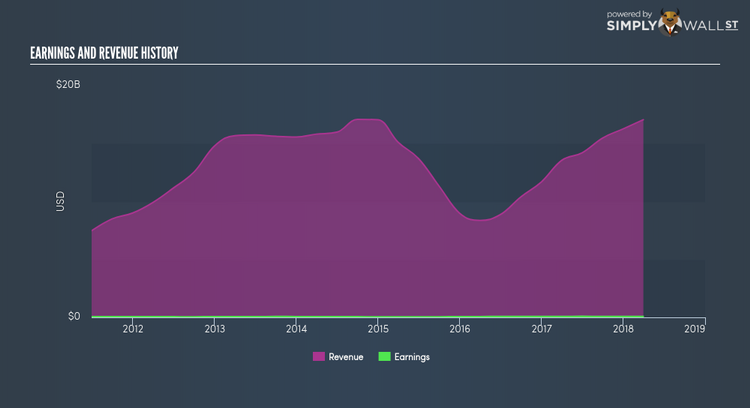
How has it been able to do this? Well, let’s take a look at whether it is merely because of industry tailwinds, or if China Aviation Oil (Singapore) has experienced some company-specific growth. Over the past few years, China Aviation Oil (Singapore) increased its bottom line faster than revenue by effectively controlling its costs. This has led to a margin expansion and profitability over time. Inspecting growth from a sector-level, the SG oil and gas industry has been enduring some headwinds in the prior twelve months, leading to an average earnings drop of -12.06%. This is a significant change, given that the industry has constantly been delivering a a solid growth of 15.61% in the past five years. This shows that whatever recent headwind the industry is enduring, China Aviation Oil (Singapore) is relatively better-cushioned than its peers.
What does this mean?
Though China Aviation Oil (Singapore)’s past data is helpful, it is only one aspect of my investment thesis. While China Aviation Oil (Singapore) has a good historical track record with positive growth and profitability, there’s no certainty that this will extrapolate into the future. You should continue to research China Aviation Oil (Singapore) to get a more holistic view of the stock by looking at:
Future Outlook: What are well-informed industry analysts predicting for G92’s future growth? Take a look at our free research report of analyst consensus for G92’s outlook.
Financial Health: Is G92’s operations financially sustainable? Balance sheets can be hard to analyze, which is why we’ve done it for you. Check out our financial health checks here.
Other High-Performing Stocks: Are there other stocks that provide better prospects with proven track records? Explore our free list of these great stocks here.
NB: Figures in this article are calculated using data from the trailing twelve months from 31 March 2018. This may not be consistent with full year annual report figures.
To help readers see pass the short term volatility of the financial market, we aim to bring you a long-term focused research analysis purely driven by fundamental data. Note that our analysis does not factor in the latest price sensitive company announcements.
The author is an independent contributor and at the time of publication had no position in the stocks mentioned.
