
 Yahoo Finance
 Cenovus Energy (CVE) Q4 Earnings Lag, '21 Capital Budget Set
Cenovus Energy Inc. CVE reported fourth-quarter 2020 loss per share of 35 cents, wider than the Zacks Consensus Estimate of a loss of 6 cents and the year-ago loss of 10 cents.
Revenues of $2,739 million declined from the year-ago $3,665 million.
The leading energy firm’s quarterly results were weak due to lower contributions from oil sands operations, partially offset by a decline in transportation and blending expenses. Notably, a weak pricing environment of commodities owing to the coronavirus pandemic hurt the company’s bottom line.
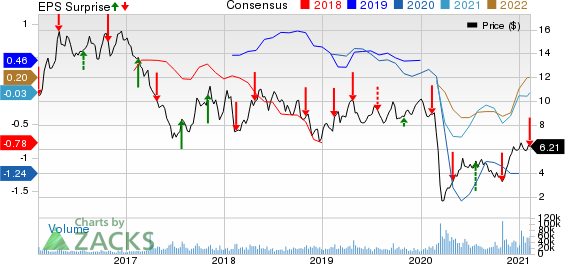
Cenovus Energy Inc Price, Consensus and EPS Surprise
Cenovus Energy Inc price-consensus-eps-surprise-chart | Cenovus Energy Inc Quote
Operational Performance
Quarterly gross revenues from the Oil Sands unit fell to C$2,227 million from C$2,659 million in fourth-quarter 2019. In the December quarter, the company recorded daily oil sand production of 380,693 barrels, up 2% year over year.
Notably, the segment’s operating income was C$205 million, down from C$250 million a year ago.
Gross revenues at the Conventional unit were C$184 million, down from C$190 million in the year-ago quarter. In the December quarter, the company recorded daily liquids production of 24,587 barrels, down 6% year over year.
The segment’s operating loss came in at C$292 million versus the loss of C$55 million in the year-ago quarter.
The Refining and Marketing segment generated gross revenues of C$1,345 million, down from C$2,555 million a year ago. Moreover, the unit’s operating loss was C$139 million against a profit of C$42 million a year ago.
Expenses
Transportation and blending expenses in the reported quarter contracted to C$1,137 million from C$1,416 million a year ago. Moreover, expenses for purchased products fell to C$1,145 million from C$2,034 million in the prior-year quarter. Operating costs in the quarter were C$485 million, down from the year-ago level of C$514 million.
Capital Expenditures & Balance Sheet
The company incurred total capital expenditure of C$250 million in the quarter under review.
As of Dec 31, 2020, the Canadian energy player had cash and cash equivalents of C$378 million. Total long-term debt was C$7,441 million. Its total debt to capitalization was 31.2%.
2021 Guidance
On Jan 28, the company announced projection for oil sands production in 2021 in the band of 524 thousand barrel per day (MBbl/D) to 586 MBbl/D. For oil sands business, the company plans capital expenditure of C$850 million to C$950 million.
The company sets C$1,220 million to C$1,410 million of capital spending budget for upstream business in 2021. For downstream operations, the company’s capital budget lies in the band of C$1,000 million to C$1,200 million.
Zacks Rank & Key Picks
Cenovus Energy currently carries a Zacks Rank #3 (Hold). Meanwhile, some better-ranked players in the energy space include Matador Resources Company MTDR, Pioneer Natural Resources Company PXD and Diamondback Energy, Inc. FANG. While Diamondback carries a Zacks Rank #2 (Buy), Matador and Pioneer Natural sport a Zacks Rank #1 (Strong Buy). You can see the complete list of today’s Zacks #1 Rank stocks here.
Matador is likely to see earnings growth of 201.3% in 2021.
Pioneer Natural has seen upward estimate revisions for 2021 earnings in the past 30 days.
Diamondback is likely to see earnings growth of 55% in 2021.
Just Released: Zacks’ 7 Best Stocks for Today
Experts extracted 7 stocks from the list of 220 Zacks Rank #1 Strong Buys that has beaten the market more than 2X over with a stunning average gain of +24.9% per year.
These 7 were selected because of their superior potential for immediate breakout.
See these time-sensitive tickers now >>
Want the latest recommendations from Zacks Investment Research? Today, you can download 7 Best Stocks for the Next 30 Days. Click to get this free report
Cenovus Energy Inc (CVE) : Free Stock Analysis Report
To read this article on Zacks.com click here.
Zacks Investment Research
