
 Yahoo Finance
 Is CapitaLand Limited’s (SGX:C31) ROE Of 7.19% Sustainable?

This article is intended for those of you who are at the beginning of your investing journey and looking to gauge the potential return on investment in CapitaLand Limited (SGX:C31).
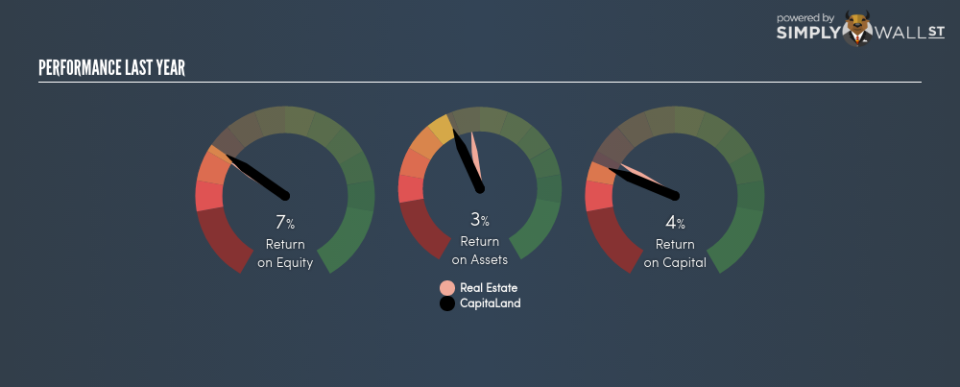
CapitaLand Limited (SGX:C31) delivered an ROE of 7.19% over the past 12 months, which is an impressive feat relative to its industry average of 6.62% during the same period. On the surface, this looks fantastic since we know that C31 has made large profits from little equity capital; however, ROE doesn’t tell us if management have borrowed heavily to make this happen. Today, we’ll take a closer look at some factors like financial leverage to see how sustainable C31’s ROE is. See our latest analysis for CapitaLand
Breaking down Return on Equity
Return on Equity (ROE) weighs CapitaLand’s profit against the level of its shareholders’ equity. It essentially shows how much the company can generate in earnings given the amount of equity it has raised. In most cases, a higher ROE is preferred; however, there are many other factors we must consider prior to making any investment decisions.
Return on Equity = Net Profit ÷ Shareholders Equity
Returns are usually compared to costs to measure the efficiency of capital. CapitaLand’s cost of equity is 10.37%. Given a discrepancy of -3.18% between return and cost, this indicated that CapitaLand may be paying more for its capital than what it’s generating in return. ROE can be dissected into three distinct ratios: net profit margin, asset turnover, and financial leverage. This is called the Dupont Formula:
Dupont Formula
ROE = profit margin × asset turnover × financial leverage
ROE = (annual net profit ÷ sales) × (sales ÷ assets) × (assets ÷ shareholders’ equity)
ROE = annual net profit ÷ shareholders’ equity
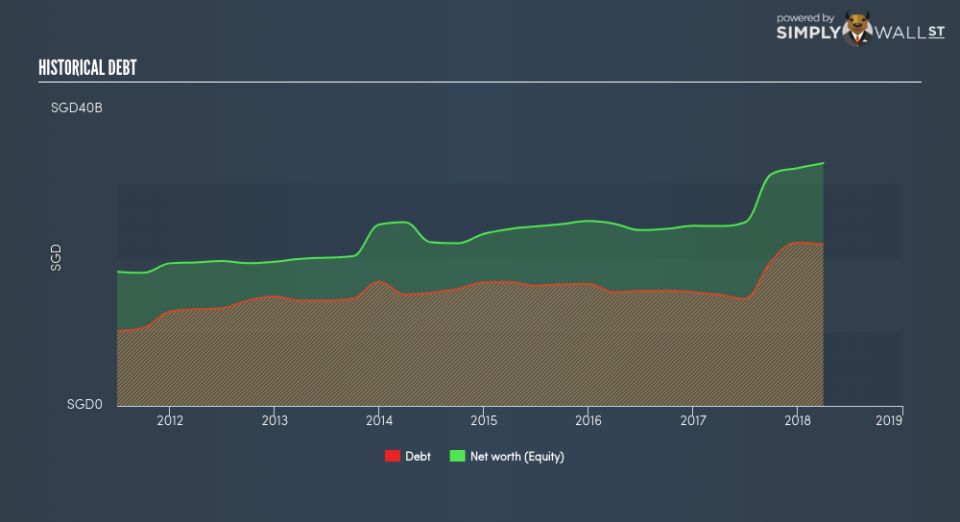
The first component is profit margin, which measures how much of sales is retained after the company pays for all its expenses. The other component, asset turnover, illustrates how much revenue CapitaLand can make from its asset base. The most interesting ratio, and reflective of sustainability of its ROE, is financial leverage. Since ROE can be inflated by excessive debt, we need to examine CapitaLand’s debt-to-equity level. At 66.47%, CapitaLand’s debt-to-equity ratio appears sensible and indicates the above-average ROE is generated from its capacity to increase profit without a large debt burden.
Next Steps:
ROE is one of many ratios which meaningfully dissects financial statements, which illustrates the quality of a company. CapitaLand exhibits a strong ROE against its peers, however it was not high enough to cover its own cost of equity this year. ROE is not likely to be inflated by excessive debt funding, giving shareholders more conviction in the sustainability of industry-beating returns. Although ROE can be a useful metric, it is only a small part of diligent research.
For CapitaLand, there are three key aspects you should further examine:
Financial Health: Does it have a healthy balance sheet? Take a look at our free balance sheet analysis with six simple checks on key factors like leverage and risk.
Management:Have insiders been ramping up their shares to take advantage of the market’s sentiment for CapitaLand’s future outlook? Check out our management and board analysis with insights on CEO compensation and governance factors.
Other High-Growth Alternatives : Are there other high-growth stocks you could be holding instead of CapitaLand? Explore our interactive list of stocks with large growth potential to get an idea of what else is out there you may be missing!
To help readers see pass the short term volatility of the financial market, we aim to bring you a long-term focused research analysis purely driven by fundamental data. Note that our analysis does not factor in the latest price sensitive company announcements.
The author is an independent contributor and at the time of publication had no position in the stocks mentioned.
