
 Yahoo Finance
 Capital Allocation Trends At Renishaw (LON:RSW) Aren't Ideal
What are the early trends we should look for to identify a stock that could multiply in value over the long term? Typically, we'll want to notice a trend of growing return on capital employed (ROCE) and alongside that, an expanding base of capital employed. Ultimately, this demonstrates that it's a business that is reinvesting profits at increasing rates of return. However, after briefly looking over the numbers, we don't think Renishaw (LON:RSW) has the makings of a multi-bagger going forward, but let's have a look at why that may be.
Return On Capital Employed (ROCE): What Is It?
For those that aren't sure what ROCE is, it measures the amount of pre-tax profits a company can generate from the capital employed in its business. The formula for this calculation on Renishaw is:
Return on Capital Employed = Earnings Before Interest and Tax (EBIT) ÷ (Total Assets - Current Liabilities)
0.13 = UK£114m ÷ (UK£988m - UK£87m) (Based on the trailing twelve months to December 2023).
Thus, Renishaw has an ROCE of 13%. By itself that's a normal return on capital and it's in line with the industry's average returns of 13%.
View our latest analysis for Renishaw
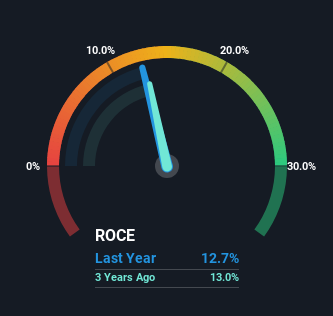
Above you can see how the current ROCE for Renishaw compares to its prior returns on capital, but there's only so much you can tell from the past. If you'd like, you can check out the forecasts from the analysts covering Renishaw for free.
How Are Returns Trending?
When we looked at the ROCE trend at Renishaw, we didn't gain much confidence. To be more specific, ROCE has fallen from 22% over the last five years. On the other hand, the company has been employing more capital without a corresponding improvement in sales in the last year, which could suggest these investments are longer term plays. It's worth keeping an eye on the company's earnings from here on to see if these investments do end up contributing to the bottom line.
Our Take On Renishaw's ROCE
In summary, Renishaw is reinvesting funds back into the business for growth but unfortunately it looks like sales haven't increased much just yet. And investors may be recognizing these trends since the stock has only returned a total of 1.7% to shareholders over the last five years. As a result, if you're hunting for a multi-bagger, we think you'd have more luck elsewhere.
While Renishaw doesn't shine too bright in this respect, it's still worth seeing if the company is trading at attractive prices. You can find that out with our FREE intrinsic value estimation for RSW on our platform.
For those who like to invest in solid companies, check out this free list of companies with solid balance sheets and high returns on equity.
Have feedback on this article? Concerned about the content? Get in touch with us directly. Alternatively, email editorial-team (at) simplywallst.com.
This article by Simply Wall St is general in nature. We provide commentary based on historical data and analyst forecasts only using an unbiased methodology and our articles are not intended to be financial advice. It does not constitute a recommendation to buy or sell any stock, and does not take account of your objectives, or your financial situation. We aim to bring you long-term focused analysis driven by fundamental data. Note that our analysis may not factor in the latest price-sensitive company announcements or qualitative material. Simply Wall St has no position in any stocks mentioned.
