
 Yahoo Finance
 Capital Allocation Trends At Creightons (LON:CRL) Aren't Ideal
There are a few key trends to look for if we want to identify the next multi-bagger. Firstly, we'd want to identify a growing return on capital employed (ROCE) and then alongside that, an ever-increasing base of capital employed. Ultimately, this demonstrates that it's a business that is reinvesting profits at increasing rates of return. However, after briefly looking over the numbers, we don't think Creightons (LON:CRL) has the makings of a multi-bagger going forward, but let's have a look at why that may be.
Understanding Return On Capital Employed (ROCE)
For those who don't know, ROCE is a measure of a company's yearly pre-tax profit (its return), relative to the capital employed in the business. The formula for this calculation on Creightons is:
Return on Capital Employed = Earnings Before Interest and Tax (EBIT) ÷ (Total Assets - Current Liabilities)
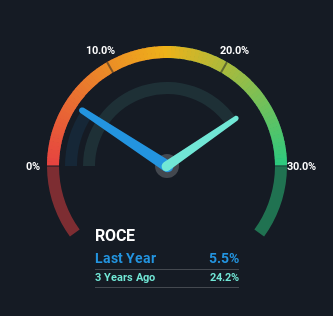
0.055 = UK£1.8m ÷ (UK£45m - UK£13m) (Based on the trailing twelve months to September 2023).
So, Creightons has an ROCE of 5.5%. Ultimately, that's a low return and it under-performs the Personal Products industry average of 12%.
See our latest analysis for Creightons
While the past is not representative of the future, it can be helpful to know how a company has performed historically, which is why we have this chart above. If you'd like to look at how Creightons has performed in the past in other metrics, you can view this free graph of Creightons' past earnings, revenue and cash flow.
How Are Returns Trending?
In terms of Creightons' historical ROCE movements, the trend isn't fantastic. Over the last five years, returns on capital have decreased to 5.5% from 19% five years ago. However it looks like Creightons might be reinvesting for long term growth because while capital employed has increased, the company's sales haven't changed much in the last 12 months. It may take some time before the company starts to see any change in earnings from these investments.
On a side note, Creightons has done well to pay down its current liabilities to 28% of total assets. So we could link some of this to the decrease in ROCE. Effectively this means their suppliers or short-term creditors are funding less of the business, which reduces some elements of risk. Some would claim this reduces the business' efficiency at generating ROCE since it is now funding more of the operations with its own money.
Our Take On Creightons' ROCE
Bringing it all together, while we're somewhat encouraged by Creightons' reinvestment in its own business, we're aware that returns are shrinking. Since the stock has declined 11% over the last five years, investors may not be too optimistic on this trend improving either. In any case, the stock doesn't have these traits of a multi-bagger discussed above, so if that's what you're looking for, we think you'd have more luck elsewhere.
Since virtually every company faces some risks, it's worth knowing what they are, and we've spotted 2 warning signs for Creightons (of which 1 can't be ignored!) that you should know about.
While Creightons isn't earning the highest return, check out this free list of companies that are earning high returns on equity with solid balance sheets.
Have feedback on this article? Concerned about the content? Get in touch with us directly. Alternatively, email editorial-team (at) simplywallst.com.
This article by Simply Wall St is general in nature. We provide commentary based on historical data and analyst forecasts only using an unbiased methodology and our articles are not intended to be financial advice. It does not constitute a recommendation to buy or sell any stock, and does not take account of your objectives, or your financial situation. We aim to bring you long-term focused analysis driven by fundamental data. Note that our analysis may not factor in the latest price-sensitive company announcements or qualitative material. Simply Wall St has no position in any stocks mentioned.
