
 Yahoo Finance
 Canacol Energy (TSE:CNE) Has Some Way To Go To Become A Multi-Bagger
What are the early trends we should look for to identify a stock that could multiply in value over the long term? Ideally, a business will show two trends; firstly a growing return on capital employed (ROCE) and secondly, an increasing amount of capital employed. This shows us that it's a compounding machine, able to continually reinvest its earnings back into the business and generate higher returns. Having said that, from a first glance at Canacol Energy (TSE:CNE) we aren't jumping out of our chairs at how returns are trending, but let's have a deeper look.
Return On Capital Employed (ROCE): What Is It?
For those that aren't sure what ROCE is, it measures the amount of pre-tax profits a company can generate from the capital employed in its business. Analysts use this formula to calculate it for Canacol Energy:
Return on Capital Employed = Earnings Before Interest and Tax (EBIT) ÷ (Total Assets - Current Liabilities)
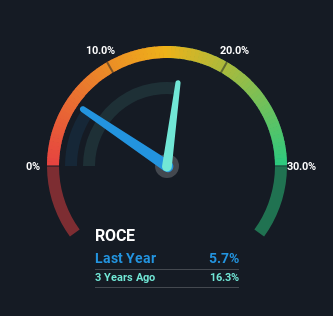
0.057 = US$56m ÷ (US$1.1b - US$145m) (Based on the trailing twelve months to September 2023).
So, Canacol Energy has an ROCE of 5.7%. Ultimately, that's a low return and it under-performs the Oil and Gas industry average of 9.9%.
View our latest analysis for Canacol Energy
Above you can see how the current ROCE for Canacol Energy compares to its prior returns on capital, but there's only so much you can tell from the past. If you're interested, you can view the analysts predictions in our free report on analyst forecasts for the company.
What Does the ROCE Trend For Canacol Energy Tell Us?
There are better returns on capital out there than what we're seeing at Canacol Energy. The company has consistently earned 5.7% for the last five years, and the capital employed within the business has risen 55% in that time. Given the company has increased the amount of capital employed, it appears the investments that have been made simply don't provide a high return on capital.
The Bottom Line
In summary, Canacol Energy has simply been reinvesting capital and generating the same low rate of return as before. Since the stock has declined 64% over the last five years, investors may not be too optimistic on this trend improving either. All in all, the inherent trends aren't typical of multi-baggers, so if that's what you're after, we think you might have more luck elsewhere.
On a final note, we found 4 warning signs for Canacol Energy (2 are a bit unpleasant) you should be aware of.
While Canacol Energy isn't earning the highest return, check out this free list of companies that are earning high returns on equity with solid balance sheets.
Have feedback on this article? Concerned about the content? Get in touch with us directly. Alternatively, email editorial-team (at) simplywallst.com.
This article by Simply Wall St is general in nature. We provide commentary based on historical data and analyst forecasts only using an unbiased methodology and our articles are not intended to be financial advice. It does not constitute a recommendation to buy or sell any stock, and does not take account of your objectives, or your financial situation. We aim to bring you long-term focused analysis driven by fundamental data. Note that our analysis may not factor in the latest price-sensitive company announcements or qualitative material. Simply Wall St has no position in any stocks mentioned.
