
 Yahoo Finance
 Calnex Solutions (LON:CLX) Could Be Struggling To Allocate Capital
What are the early trends we should look for to identify a stock that could multiply in value over the long term? In a perfect world, we'd like to see a company investing more capital into its business and ideally the returns earned from that capital are also increasing. Put simply, these types of businesses are compounding machines, meaning they are continually reinvesting their earnings at ever-higher rates of return. Although, when we looked at Calnex Solutions (LON:CLX), it didn't seem to tick all of these boxes.
What Is Return On Capital Employed (ROCE)?
For those that aren't sure what ROCE is, it measures the amount of pre-tax profits a company can generate from the capital employed in its business. Analysts use this formula to calculate it for Calnex Solutions:
Return on Capital Employed = Earnings Before Interest and Tax (EBIT) ÷ (Total Assets - Current Liabilities)
0.11 = UK£3.3m ÷ (UK£37m - UK£5.8m) (Based on the trailing twelve months to September 2023).
Therefore, Calnex Solutions has an ROCE of 11%. By itself that's a normal return on capital and it's in line with the industry's average returns of 11%.
See our latest analysis for Calnex Solutions
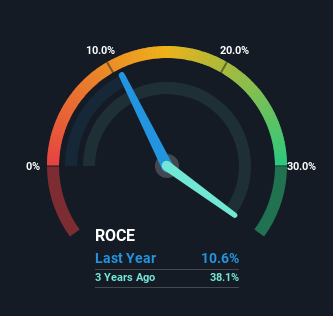
Above you can see how the current ROCE for Calnex Solutions compares to its prior returns on capital, but there's only so much you can tell from the past. If you're interested, you can view the analysts predictions in our free report on analyst forecasts for the company.
How Are Returns Trending?
When we looked at the ROCE trend at Calnex Solutions, we didn't gain much confidence. Over the last five years, returns on capital have decreased to 11% from 16% five years ago. And considering revenue has dropped while employing more capital, we'd be cautious. If this were to continue, you might be looking at a company that is trying to reinvest for growth but is actually losing market share since sales haven't increased.
The Bottom Line
In summary, we're somewhat concerned by Calnex Solutions' diminishing returns on increasing amounts of capital. Long term shareholders who've owned the stock over the last three years have experienced a 31% depreciation in their investment, so it appears the market might not like these trends either. Unless there is a shift to a more positive trajectory in these metrics, we would look elsewhere.
Calnex Solutions does have some risks, we noticed 4 warning signs (and 2 which are a bit concerning) we think you should know about.
For those who like to invest in solid companies, check out this free list of companies with solid balance sheets and high returns on equity.
Have feedback on this article? Concerned about the content? Get in touch with us directly. Alternatively, email editorial-team (at) simplywallst.com.
This article by Simply Wall St is general in nature. We provide commentary based on historical data and analyst forecasts only using an unbiased methodology and our articles are not intended to be financial advice. It does not constitute a recommendation to buy or sell any stock, and does not take account of your objectives, or your financial situation. We aim to bring you long-term focused analysis driven by fundamental data. Note that our analysis may not factor in the latest price-sensitive company announcements or qualitative material. Simply Wall St has no position in any stocks mentioned.
