
 Yahoo Finance
 California BanCorp (NASDAQ:CALB) shareholders have earned a 8.9% CAGR over the last three years
One simple way to benefit from the stock market is to buy an index fund. But if you pick the right individual stocks, you could make more than that. For example, California BanCorp (NASDAQ:CALB) shareholders have seen the share price rise 29% over three years, well in excess of the market return (14%, not including dividends). However, more recent returns haven't been as impressive as that, with the stock returning just 20% in the last year.
With that in mind, it's worth seeing if the company's underlying fundamentals have been the driver of long term performance, or if there are some discrepancies.
Check out our latest analysis for California BanCorp
In his essay The Superinvestors of Graham-and-Doddsville Warren Buffett described how share prices do not always rationally reflect the value of a business. One way to examine how market sentiment has changed over time is to look at the interaction between a company's share price and its earnings per share (EPS).
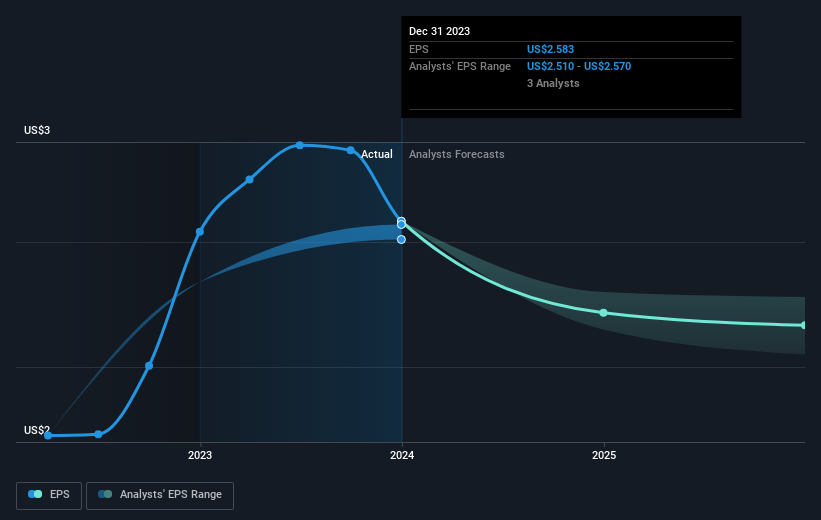
During three years of share price growth, California BanCorp achieved compound earnings per share growth of 69% per year. This EPS growth is higher than the 9% average annual increase in the share price. So it seems investors have become more cautious about the company, over time. We'd venture the lowish P/E ratio of 8.54 also reflects the negative sentiment around the stock.
The graphic below depicts how EPS has changed over time (unveil the exact values by clicking on the image).
We like that insiders have been buying shares in the last twelve months. Even so, future earnings will be far more important to whether current shareholders make money. Dive deeper into the earnings by checking this interactive graph of California BanCorp's earnings, revenue and cash flow.
A Different Perspective
California BanCorp shareholders are up 20% for the year. But that return falls short of the market. On the bright side, that's still a gain, and it's actually better than the average return of 3% over half a decade This suggests the company might be improving over time. It's always interesting to track share price performance over the longer term. But to understand California BanCorp better, we need to consider many other factors. Like risks, for instance. Every company has them, and we've spotted 2 warning signs for California BanCorp (of which 1 makes us a bit uncomfortable!) you should know about.
California BanCorp is not the only stock insiders are buying. So take a peek at this free list of growing companies with insider buying.
Please note, the market returns quoted in this article reflect the market weighted average returns of stocks that currently trade on American exchanges.
Have feedback on this article? Concerned about the content? Get in touch with us directly. Alternatively, email editorial-team (at) simplywallst.com.
This article by Simply Wall St is general in nature. We provide commentary based on historical data and analyst forecasts only using an unbiased methodology and our articles are not intended to be financial advice. It does not constitute a recommendation to buy or sell any stock, and does not take account of your objectives, or your financial situation. We aim to bring you long-term focused analysis driven by fundamental data. Note that our analysis may not factor in the latest price-sensitive company announcements or qualitative material. Simply Wall St has no position in any stocks mentioned.
