
 Yahoo Finance
 Calculating The Intrinsic Value Of RH PetroGas Limited (SGX:T13)
Key Insights
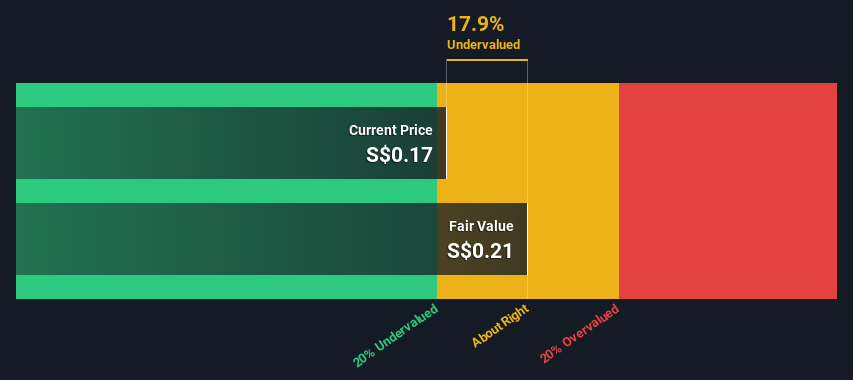
Using the 2 Stage Free Cash Flow to Equity, RH PetroGas fair value estimate is S$0.21
Current share price of S$0.17 suggests RH PetroGas is potentially trading close to its fair value
When compared to theindustry average discount to fair value of 52%, RH PetroGas' competitors seem to be trading at a greater discount
Today we'll do a simple run through of a valuation method used to estimate the attractiveness of RH PetroGas Limited (SGX:T13) as an investment opportunity by taking the expected future cash flows and discounting them to today's value. One way to achieve this is by employing the Discounted Cash Flow (DCF) model. It may sound complicated, but actually it is quite simple!
Remember though, that there are many ways to estimate a company's value, and a DCF is just one method. For those who are keen learners of equity analysis, the Simply Wall St analysis model here may be something of interest to you.
See our latest analysis for RH PetroGas
Crunching The Numbers
We're using the 2-stage growth model, which simply means we take in account two stages of company's growth. In the initial period the company may have a higher growth rate and the second stage is usually assumed to have a stable growth rate. In the first stage we need to estimate the cash flows to the business over the next ten years. Seeing as no analyst estimates of free cash flow are available to us, we have extrapolate the previous free cash flow (FCF) from the company's last reported value. We assume companies with shrinking free cash flow will slow their rate of shrinkage, and that companies with growing free cash flow will see their growth rate slow, over this period. We do this to reflect that growth tends to slow more in the early years than it does in later years.
Generally we assume that a dollar today is more valuable than a dollar in the future, so we discount the value of these future cash flows to their estimated value in today's dollars:
10-year free cash flow (FCF) estimate
2024 | 2025 | 2026 | 2027 | 2028 | 2029 | 2030 | 2031 | 2032 | 2033 | |
Levered FCF ($, Millions) | US$10.2m | US$8.99m | US$8.27m | US$7.86m | US$7.63m | US$7.53m | US$7.50m | US$7.53m | US$7.59m | US$7.69m |
Growth Rate Estimate Source | Est @ -18.42% | Est @ -12.28% | Est @ -7.98% | Est @ -4.97% | Est @ -2.86% | Est @ -1.39% | Est @ -0.36% | Est @ 0.36% | Est @ 0.87% | Est @ 1.22% |
Present Value ($, Millions) Discounted @ 7.4% | US$9.5 | US$7.8 | US$6.7 | US$5.9 | US$5.3 | US$4.9 | US$4.5 | US$4.2 | US$4.0 | US$3.8 |
("Est" = FCF growth rate estimated by Simply Wall St)
Present Value of 10-year Cash Flow (PVCF) = US$57m
After calculating the present value of future cash flows in the initial 10-year period, we need to calculate the Terminal Value, which accounts for all future cash flows beyond the first stage. For a number of reasons a very conservative growth rate is used that cannot exceed that of a country's GDP growth. In this case we have used the 5-year average of the 10-year government bond yield (2.1%) to estimate future growth. In the same way as with the 10-year 'growth' period, we discount future cash flows to today's value, using a cost of equity of 7.4%.
Terminal Value (TV)= FCF2033 × (1 + g) ÷ (r – g) = US$7.7m× (1 + 2.1%) ÷ (7.4%– 2.1%) = US$146m
Present Value of Terminal Value (PVTV)= TV / (1 + r)10= US$146m÷ ( 1 + 7.4%)10= US$71m
The total value, or equity value, is then the sum of the present value of the future cash flows, which in this case is US$128m. To get the intrinsic value per share, we divide this by the total number of shares outstanding. Relative to the current share price of S$0.2, the company appears about fair value at a 18% discount to where the stock price trades currently. The assumptions in any calculation have a big impact on the valuation, so it is better to view this as a rough estimate, not precise down to the last cent.
The Assumptions
Now the most important inputs to a discounted cash flow are the discount rate, and of course, the actual cash flows. Part of investing is coming up with your own evaluation of a company's future performance, so try the calculation yourself and check your own assumptions. The DCF also does not consider the possible cyclicality of an industry, or a company's future capital requirements, so it does not give a full picture of a company's potential performance. Given that we are looking at RH PetroGas as potential shareholders, the cost of equity is used as the discount rate, rather than the cost of capital (or weighted average cost of capital, WACC) which accounts for debt. In this calculation we've used 7.4%, which is based on a levered beta of 1.171. Beta is a measure of a stock's volatility, compared to the market as a whole. We get our beta from the industry average beta of globally comparable companies, with an imposed limit between 0.8 and 2.0, which is a reasonable range for a stable business.
SWOT Analysis for RH PetroGas
Strength
Currently debt free.
Weakness
Earnings declined over the past year.
Opportunity
Annual earnings are forecast to grow for the next 3 years.
Current share price is below our estimate of fair value.
Threat
No apparent threats visible for T13.
Looking Ahead:
Whilst important, the DCF calculation shouldn't be the only metric you look at when researching a company. It's not possible to obtain a foolproof valuation with a DCF model. Rather it should be seen as a guide to "what assumptions need to be true for this stock to be under/overvalued?" For example, changes in the company's cost of equity or the risk free rate can significantly impact the valuation. For RH PetroGas, we've put together three fundamental elements you should assess:
Risks: Every company has them, and we've spotted 2 warning signs for RH PetroGas you should know about.
Future Earnings: How does T13's growth rate compare to its peers and the wider market? Dig deeper into the analyst consensus number for the upcoming years by interacting with our free analyst growth expectation chart.
Other High Quality Alternatives: Do you like a good all-rounder? Explore our interactive list of high quality stocks to get an idea of what else is out there you may be missing!
PS. The Simply Wall St app conducts a discounted cash flow valuation for every stock on the SGX every day. If you want to find the calculation for other stocks just search here.
Have feedback on this article? Concerned about the content? Get in touch with us directly. Alternatively, email editorial-team (at) simplywallst.com.
This article by Simply Wall St is general in nature. We provide commentary based on historical data and analyst forecasts only using an unbiased methodology and our articles are not intended to be financial advice. It does not constitute a recommendation to buy or sell any stock, and does not take account of your objectives, or your financial situation. We aim to bring you long-term focused analysis driven by fundamental data. Note that our analysis may not factor in the latest price-sensitive company announcements or qualitative material. Simply Wall St has no position in any stocks mentioned.
