
 Yahoo Finance
 Calculating The Fair Value Of Domo, Inc. (NASDAQ:DOMO)
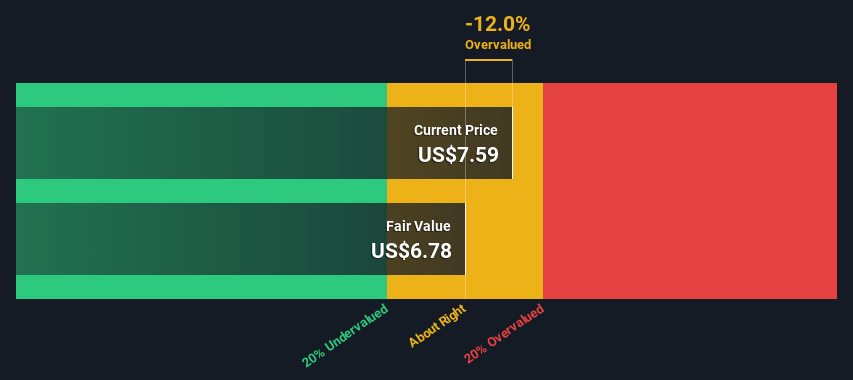
Key Insights
Domo's estimated fair value is US$6.78 based on 2 Stage Free Cash Flow to Equity
Current share price of US$7.59 suggests Domo is potentially trading close to its fair value
The US$14.50 analyst price target for DOMO is 114% more than our estimate of fair value
Today we'll do a simple run through of a valuation method used to estimate the attractiveness of Domo, Inc. (NASDAQ:DOMO) as an investment opportunity by taking the expected future cash flows and discounting them to their present value. Our analysis will employ the Discounted Cash Flow (DCF) model. Believe it or not, it's not too difficult to follow, as you'll see from our example!
Companies can be valued in a lot of ways, so we would point out that a DCF is not perfect for every situation. If you want to learn more about discounted cash flow, the rationale behind this calculation can be read in detail in the Simply Wall St analysis model.
See our latest analysis for Domo
The Method
We are going to use a two-stage DCF model, which, as the name states, takes into account two stages of growth. The first stage is generally a higher growth period which levels off heading towards the terminal value, captured in the second 'steady growth' period. In the first stage we need to estimate the cash flows to the business over the next ten years. Where possible we use analyst estimates, but when these aren't available we extrapolate the previous free cash flow (FCF) from the last estimate or reported value. We assume companies with shrinking free cash flow will slow their rate of shrinkage, and that companies with growing free cash flow will see their growth rate slow, over this period. We do this to reflect that growth tends to slow more in the early years than it does in later years.
A DCF is all about the idea that a dollar in the future is less valuable than a dollar today, so we discount the value of these future cash flows to their estimated value in today's dollars:
10-year free cash flow (FCF) forecast
2024 | 2025 | 2026 | 2027 | 2028 | 2029 | 2030 | 2031 | 2032 | 2033 | |
Levered FCF ($, Millions) | -US$10.2m | US$1.45m | US$9.45m | US$12.4m | US$14.6m | US$16.6m | US$18.2m | US$19.6m | US$20.8m | US$21.8m |
Growth Rate Estimate Source | Analyst x2 | Analyst x2 | Analyst x2 | Analyst x1 | Est @ 18.01% | Est @ 13.29% | Est @ 9.99% | Est @ 7.68% | Est @ 6.06% | Est @ 4.93% |
Present Value ($, Millions) Discounted @ 7.9% | -US$9.5 | US$1.2 | US$7.5 | US$9.1 | US$10.0 | US$10.5 | US$10.7 | US$10.7 | US$10.5 | US$10.2 |
("Est" = FCF growth rate estimated by Simply Wall St)
Present Value of 10-year Cash Flow (PVCF) = US$71m
After calculating the present value of future cash flows in the initial 10-year period, we need to calculate the Terminal Value, which accounts for all future cash flows beyond the first stage. For a number of reasons a very conservative growth rate is used that cannot exceed that of a country's GDP growth. In this case we have used the 5-year average of the 10-year government bond yield (2.3%) to estimate future growth. In the same way as with the 10-year 'growth' period, we discount future cash flows to today's value, using a cost of equity of 7.9%.
Terminal Value (TV)= FCF2033 × (1 + g) ÷ (r – g) = US$22m× (1 + 2.3%) ÷ (7.9%– 2.3%) = US$399m
Present Value of Terminal Value (PVTV)= TV / (1 + r)10= US$399m÷ ( 1 + 7.9%)10= US$187m
The total value, or equity value, is then the sum of the present value of the future cash flows, which in this case is US$258m. To get the intrinsic value per share, we divide this by the total number of shares outstanding. Relative to the current share price of US$7.6, the company appears around fair value at the time of writing. The assumptions in any calculation have a big impact on the valuation, so it is better to view this as a rough estimate, not precise down to the last cent.
The Assumptions
The calculation above is very dependent on two assumptions. The first is the discount rate and the other is the cash flows. Part of investing is coming up with your own evaluation of a company's future performance, so try the calculation yourself and check your own assumptions. The DCF also does not consider the possible cyclicality of an industry, or a company's future capital requirements, so it does not give a full picture of a company's potential performance. Given that we are looking at Domo as potential shareholders, the cost of equity is used as the discount rate, rather than the cost of capital (or weighted average cost of capital, WACC) which accounts for debt. In this calculation we've used 7.9%, which is based on a levered beta of 1.216. Beta is a measure of a stock's volatility, compared to the market as a whole. We get our beta from the industry average beta of globally comparable companies, with an imposed limit between 0.8 and 2.0, which is a reasonable range for a stable business.
SWOT Analysis for Domo
Strength
No major strengths identified for DOMO.
Weakness
Shareholders have been diluted in the past year.
Opportunity
Has sufficient cash runway for more than 3 years based on current free cash flows.
Good value based on P/S ratio compared to estimated Fair P/S ratio.
Threat
Debt is not well covered by operating cash flow.
Total liabilities exceed total assets, which raises the risk of financial distress.
Not expected to become profitable over the next 3 years.
Looking Ahead:
Valuation is only one side of the coin in terms of building your investment thesis, and it is only one of many factors that you need to assess for a company. DCF models are not the be-all and end-all of investment valuation. Instead the best use for a DCF model is to test certain assumptions and theories to see if they would lead to the company being undervalued or overvalued. For instance, if the terminal value growth rate is adjusted slightly, it can dramatically alter the overall result. For Domo, we've put together three relevant aspects you should further examine:
Risks: You should be aware of the 4 warning signs for Domo (1 doesn't sit too well with us!) we've uncovered before considering an investment in the company.
Management:Have insiders been ramping up their shares to take advantage of the market's sentiment for DOMO's future outlook? Check out our management and board analysis with insights on CEO compensation and governance factors.
Other High Quality Alternatives: Do you like a good all-rounder? Explore our interactive list of high quality stocks to get an idea of what else is out there you may be missing!
PS. The Simply Wall St app conducts a discounted cash flow valuation for every stock on the NASDAQGM every day. If you want to find the calculation for other stocks just search here.
Have feedback on this article? Concerned about the content? Get in touch with us directly. Alternatively, email editorial-team (at) simplywallst.com.
This article by Simply Wall St is general in nature. We provide commentary based on historical data and analyst forecasts only using an unbiased methodology and our articles are not intended to be financial advice. It does not constitute a recommendation to buy or sell any stock, and does not take account of your objectives, or your financial situation. We aim to bring you long-term focused analysis driven by fundamental data. Note that our analysis may not factor in the latest price-sensitive company announcements or qualitative material. Simply Wall St has no position in any stocks mentioned.
